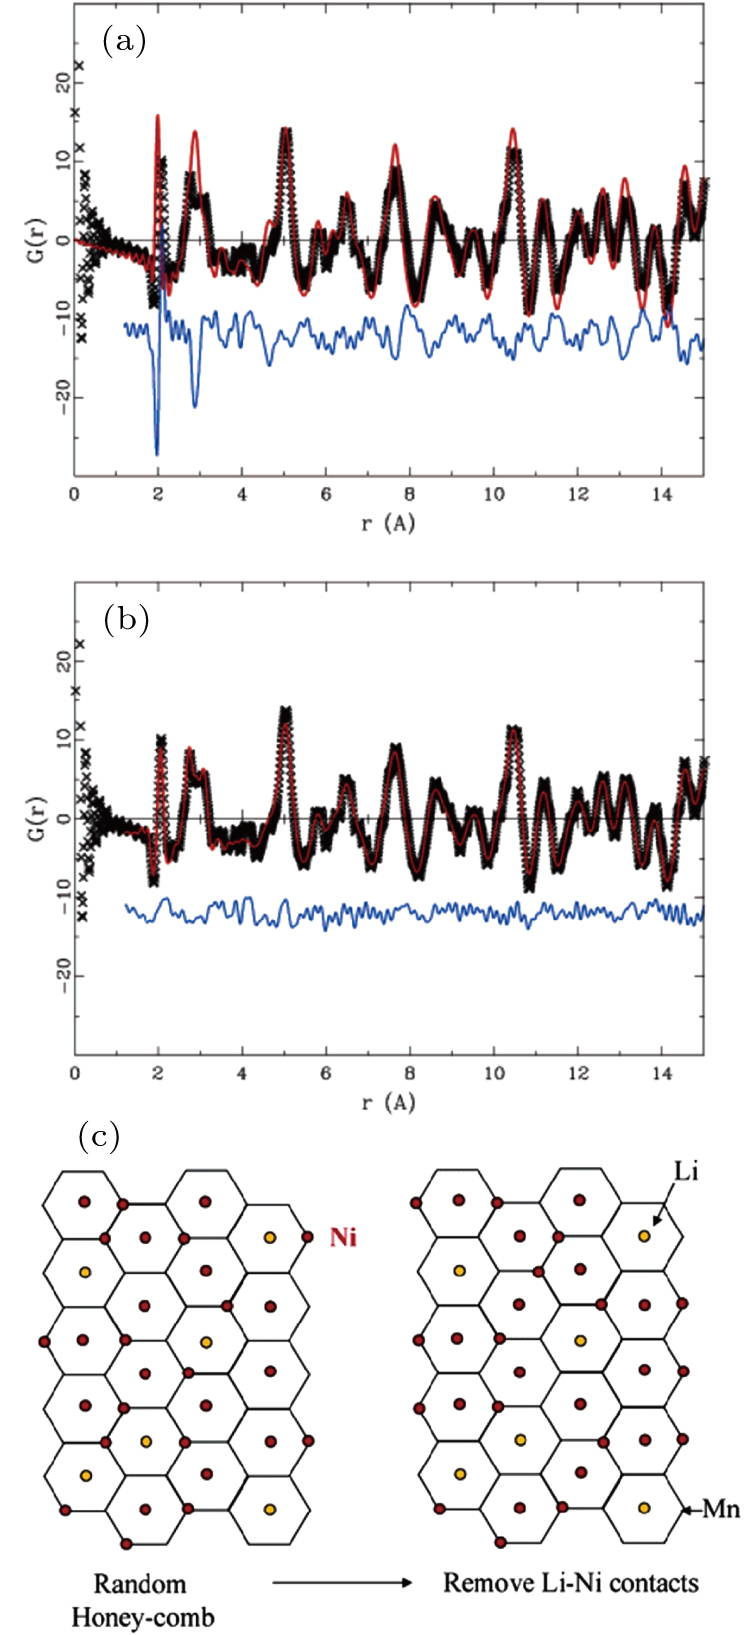
Reverse Monte–Carlo simulation results for pristine[7] LiNi0.5Mn0.5O2: (a) the fitting results by using the initial random cluster model, and (b) the fitting results after the RMC calculations. Black crosses: experimental data, solid red line: calculated PDF, blue line: difference between the calculated and experimental patterns. (c) The transition metal layers for LiNi0.5Mn0.5O2 with 10% of Li/Ni site exchange are represented by honeycomb, within which the atoms are distributed randomly. Yellow circles: Li atoms; red circles: Ni atoms; corners without circles: Mn.[23] |

