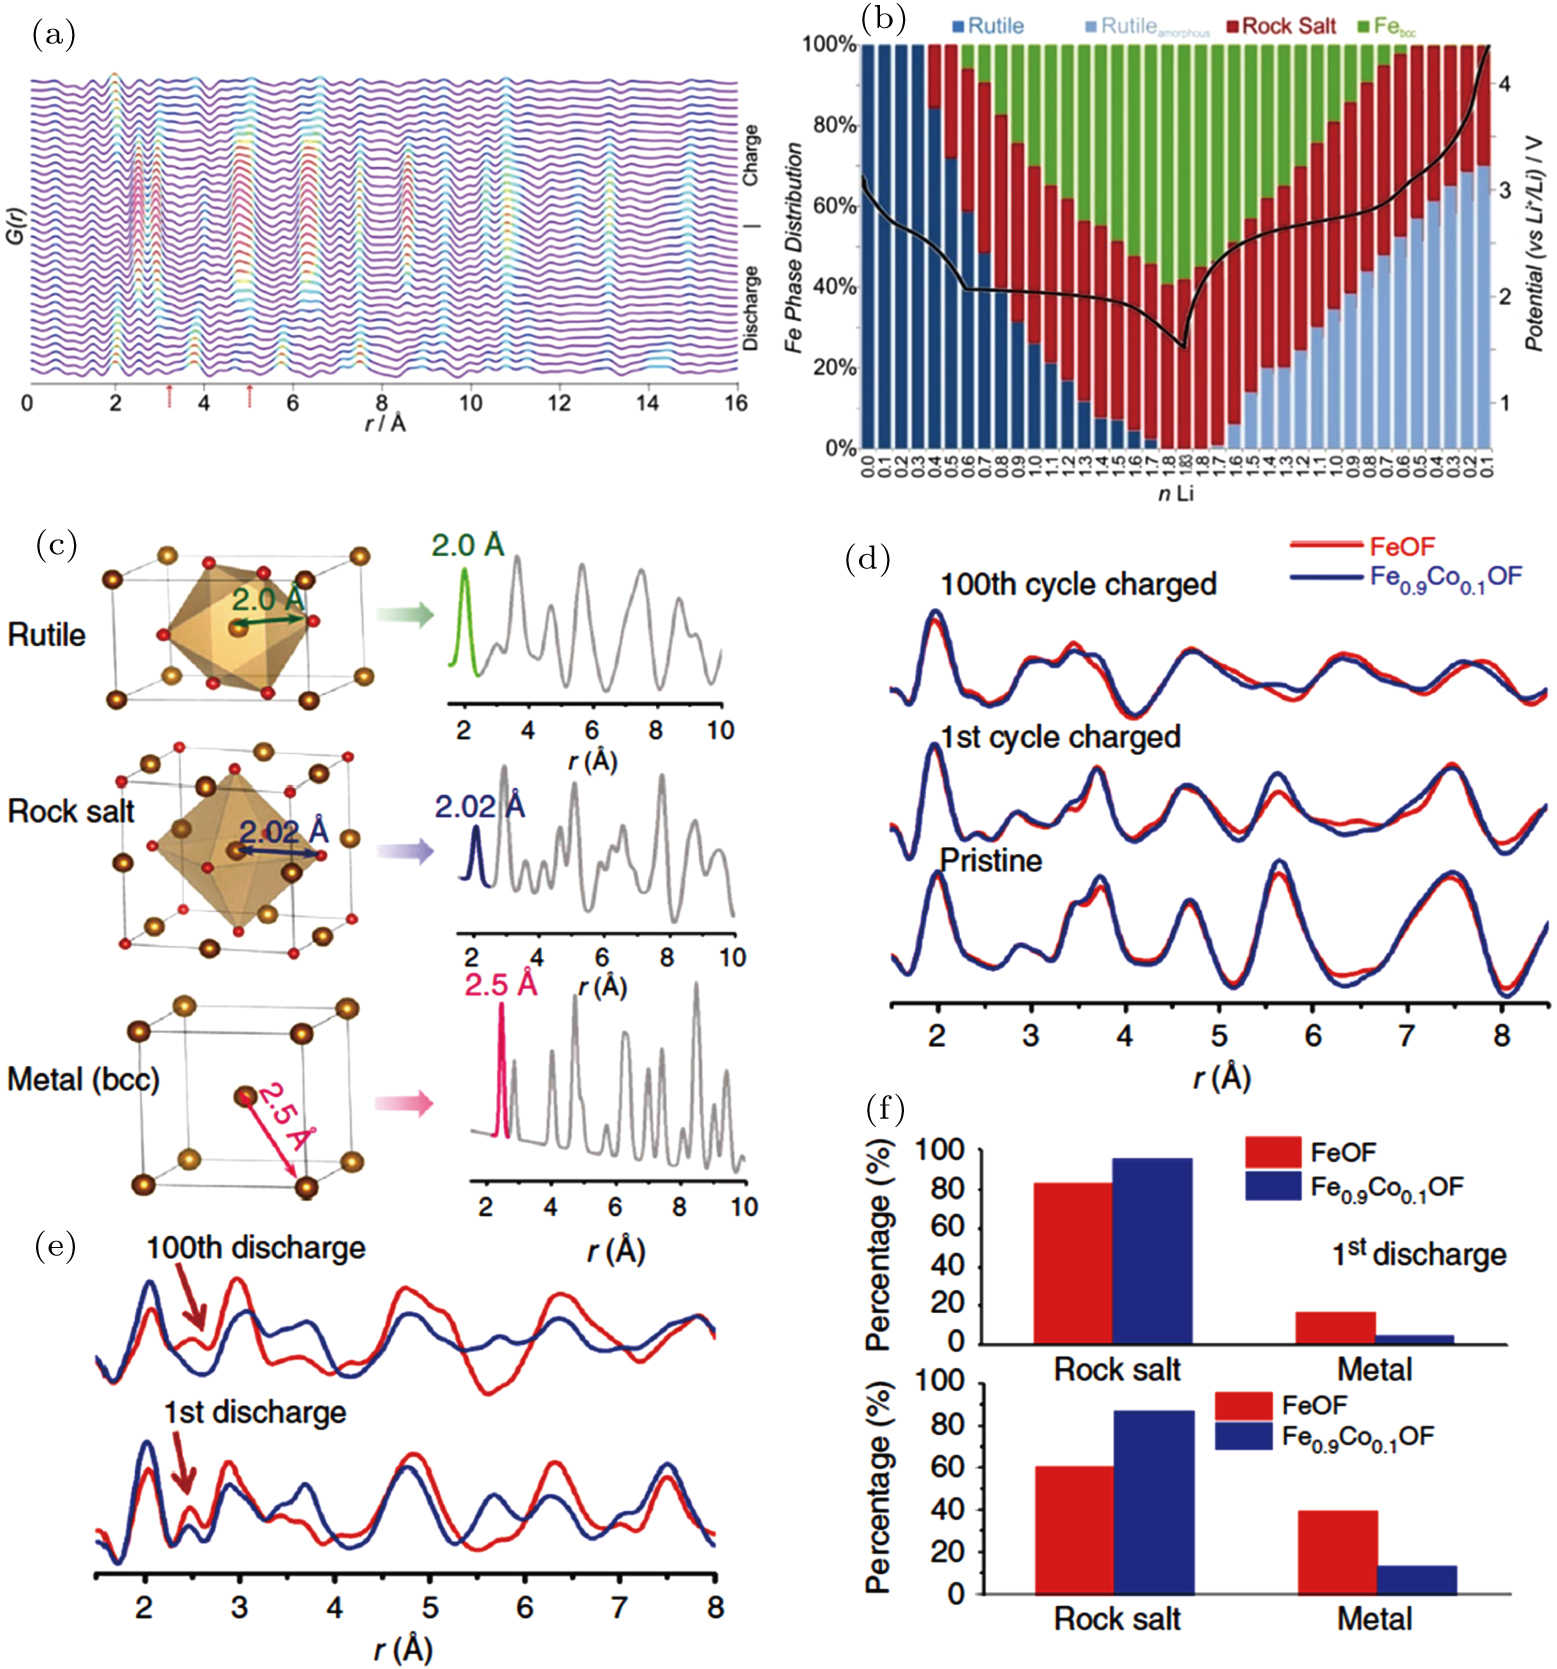
(a) The in situ PDF data of iron oxyfluoride (
Fe(1−x)IIFexIIIOxF2−x
, x = 0.6) during the first discharge–charge cycle. Characteristic peaks of the rock salt intermediate are indicated by arrows. Relative peak intensities are indicated by colors. (b) Evolution of phase composition in
Fe(1−x)IIFexIIIOxF2−x
(x = 0.6) during cycling. (c) Characteristic atomic pairs in rutile, rocksalt, and body-centered-cubic metal and their corresponding PDF peaks. (d) PDF patterns of Fe0.9Co0.1OF and FeOF at pristine state, charged state after the 1st cycle, and charged state after the 100th cycle. (e) PDF patterns of Fe0.9Co0.1OF and FeOF at discharged state after the 1st cycle and discharged state after the 100th cycle. (f) Percentages of metal and rocksalt phases in Fe0.9Co0.1OF and FeOF obtained by fitting PDF results.[48,49] |

