Advanced characterization and calculation methods for rechargeable battery materials in multiple scales
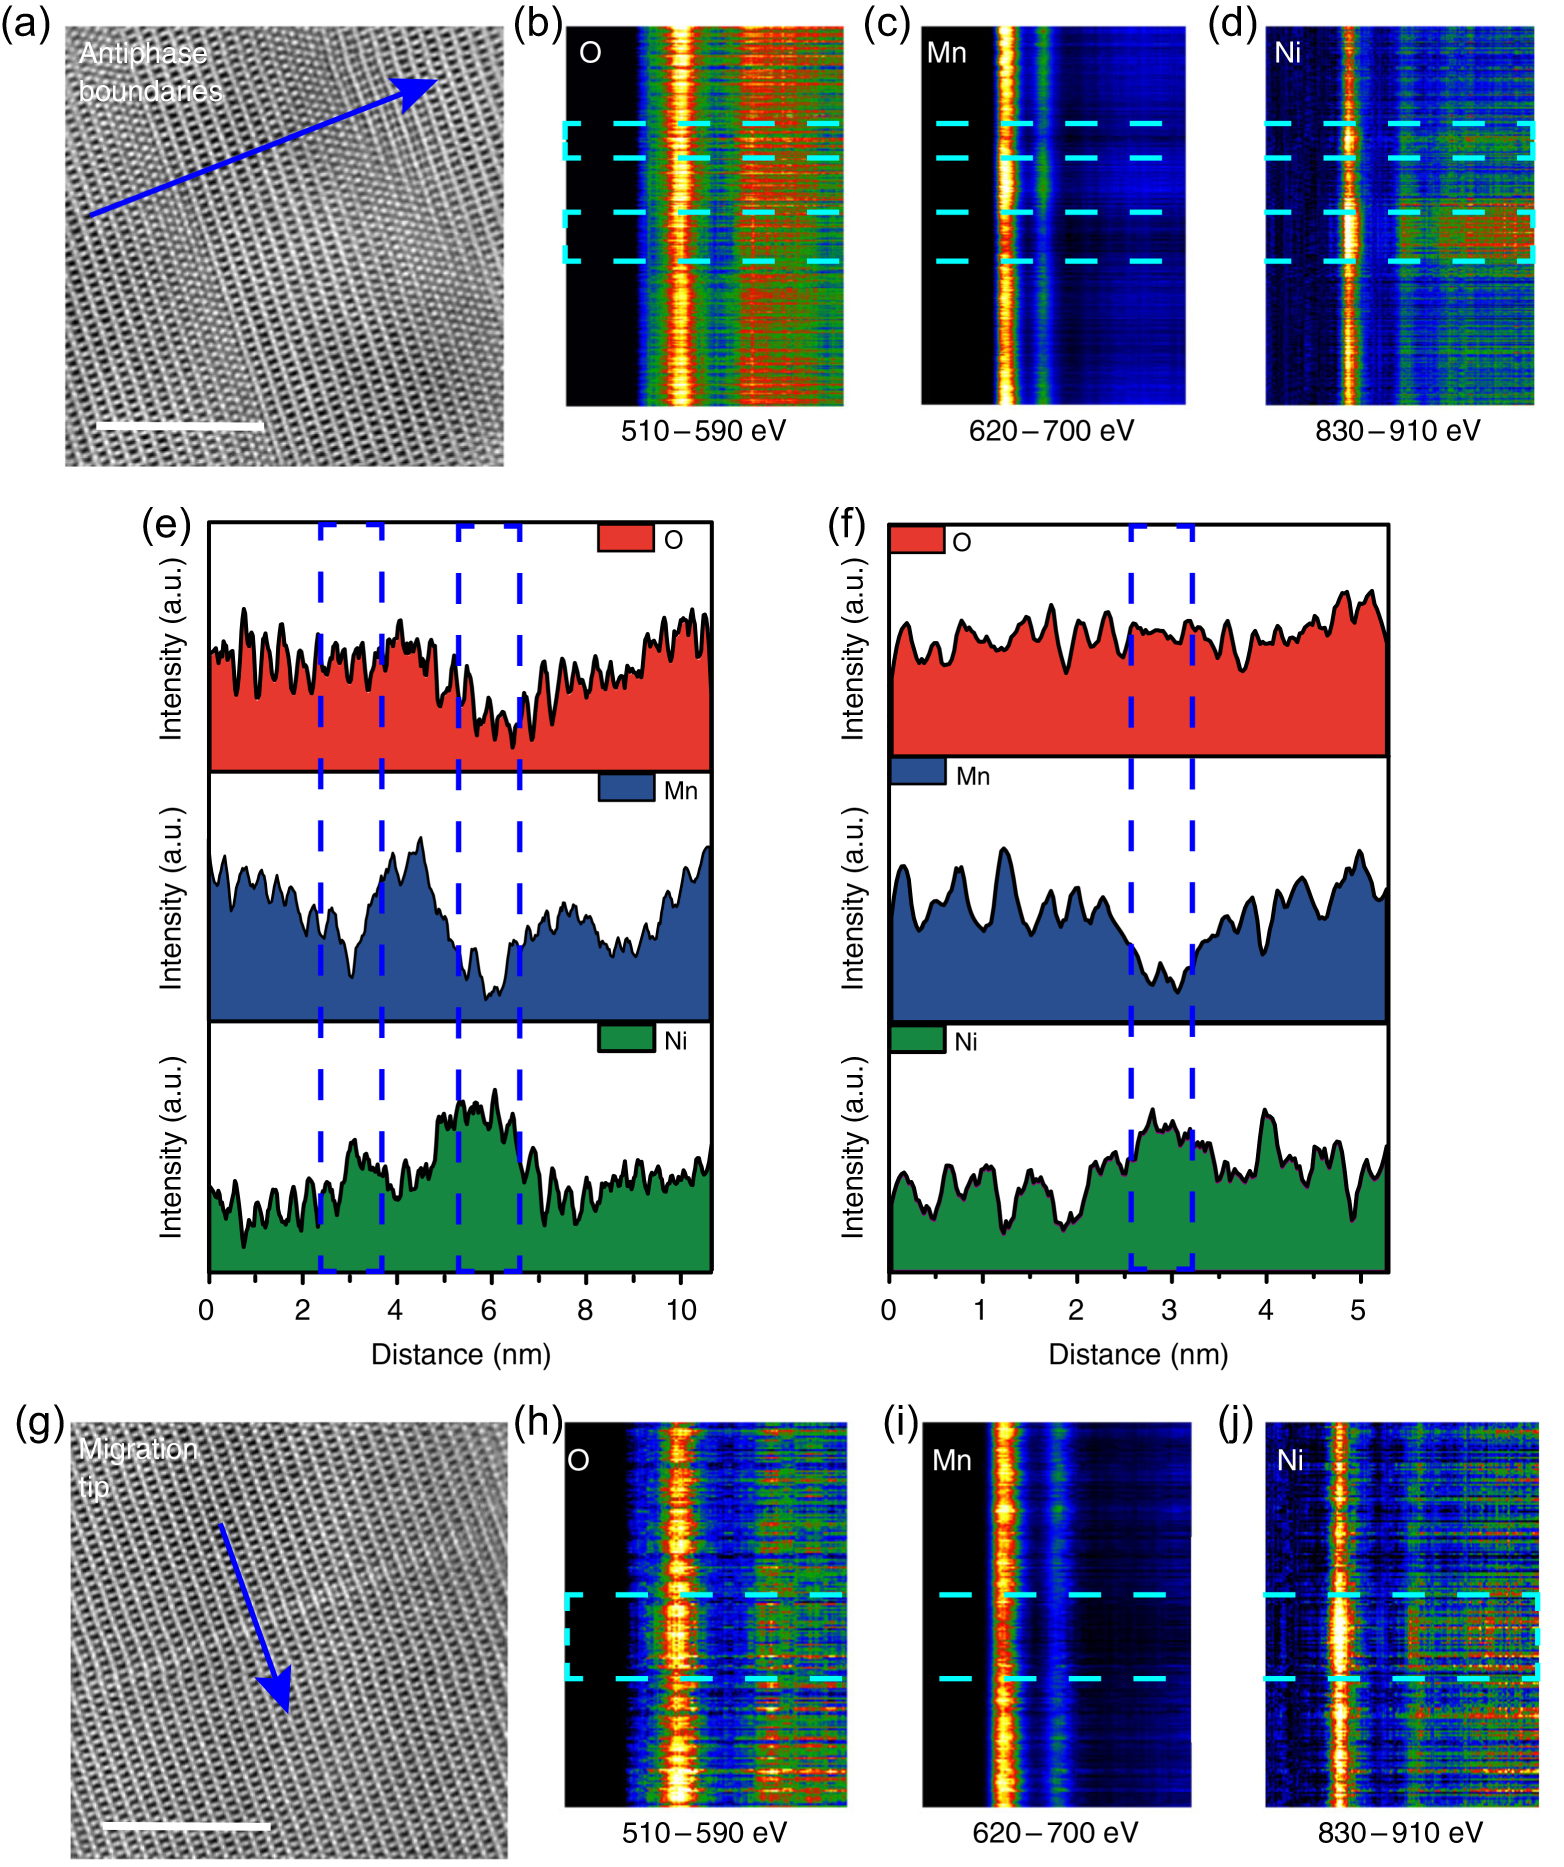
(a) HAADF image of antiphase boundaries with blue arrow showing the EELS line scan trajectory. (b)–(d) EELS spectra of O, Mn, and Ni. The dashed rectangle represents two antiphase boundaries in (a). Elements content distribution results of EELS from antiphase boundaries region (e) and migration front region (f). (g) HAADF image of migration front area with blue arrow showing the EELS line scan trajectory. (h)–(j) EELS spectra of O, Mn, and Ni. The dashed rectangle represents migration front in (g). Scale bar, 5 nm.[