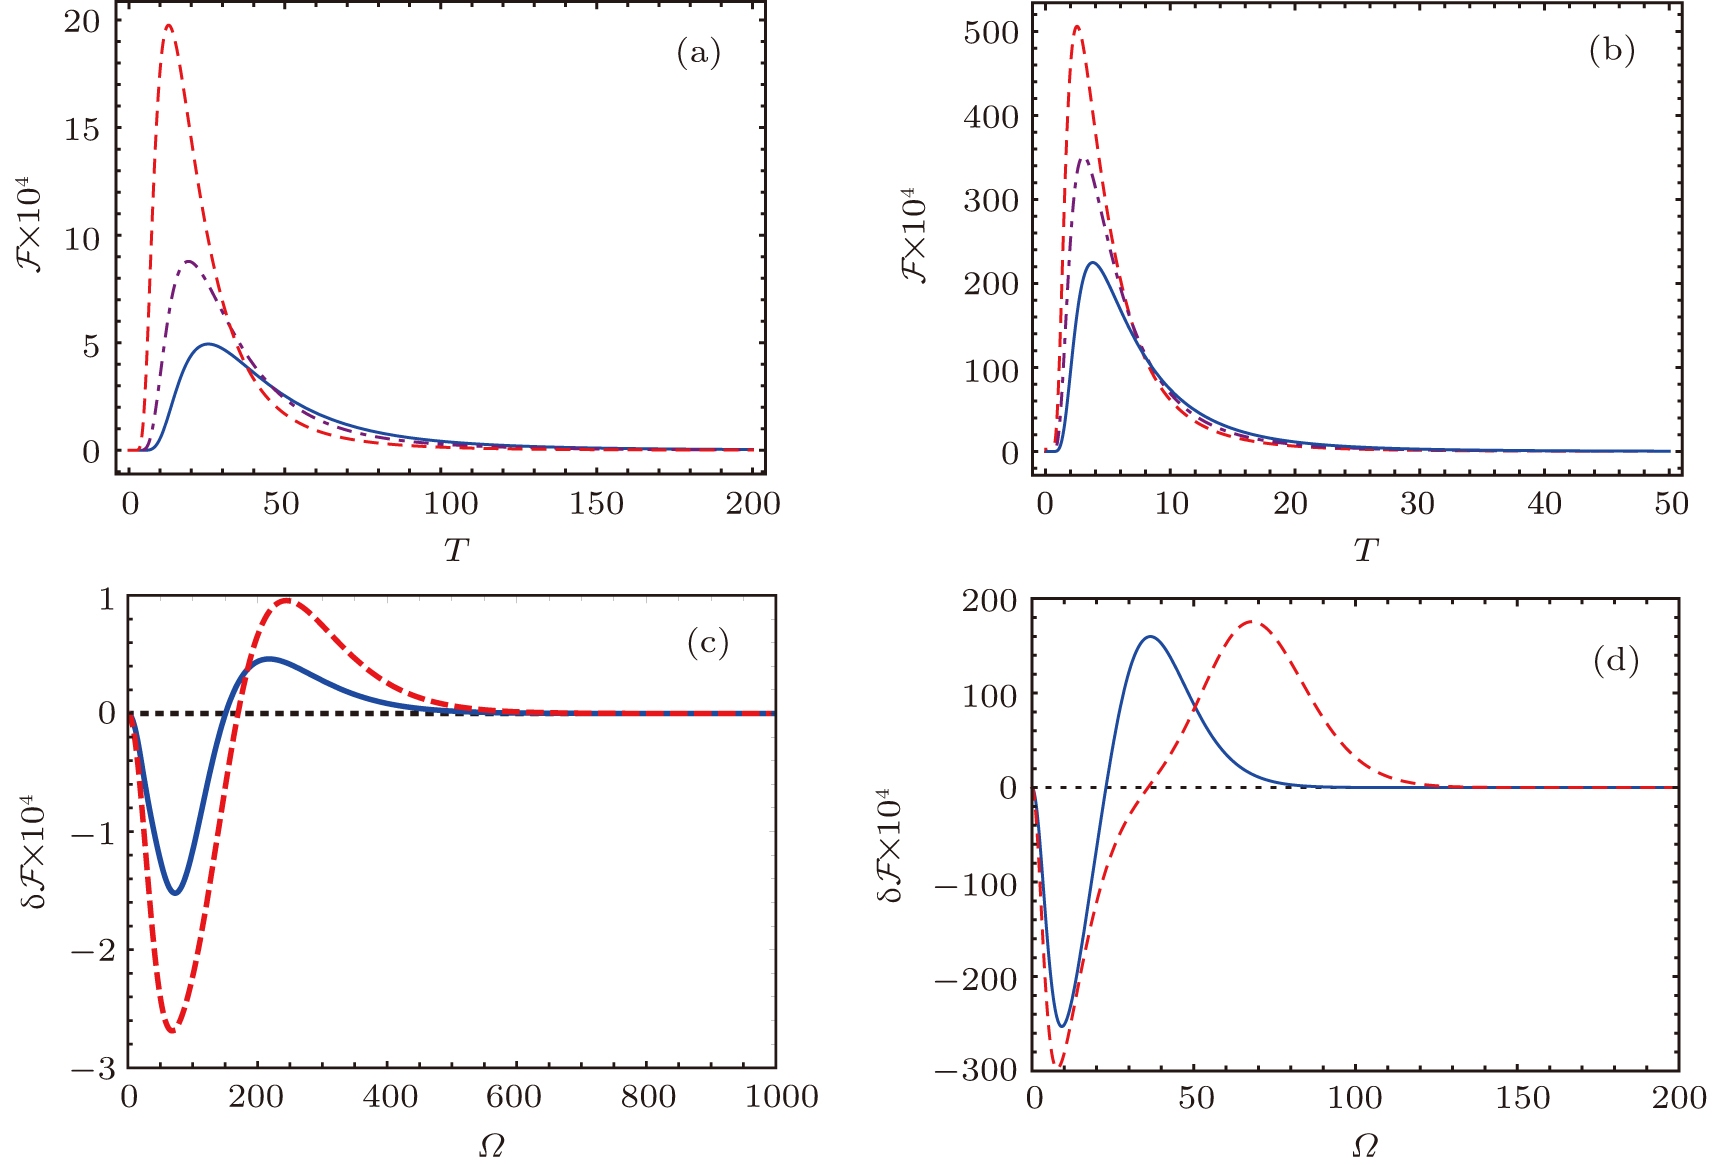
(a) The total QFI ℱ
with J = 1 is plotted as the function of temperature T: Ω = 50 (red dashed line), Ω = 75 (purple dotdashed line), and Ω = 100 (blue solid line). Other parameters are chosen as λ = 0.1Ω and ε = Ω. (b) The total QFI ℱ
with J = 3/2 is plotted as the function of temperature T: Ω = 10 (red dashed line), Ω = 12 (purple dotdashed line), and Ω = 15 (blue solid line). Other parameters are chosen as λ = 0.1Ω and ε = Ω. (c) The corrected QFI δℱ
at T = 50 is plotted as the function of Ω: J = 1 (blue solid line) and J = 3/2 (red dashed line). Other parameters are chosen as λ = 100 and ε = Ω. (d) The corrected QFI δℱ
at T = 5 is plotted as the function of Ω: J = 1 (blue solid line) and J = 3/2 (red dashed line). Other parameters are chosen as λ = 30 and ε = Ω. In our calculation, temperature, the frequency of IHO, and QFI are expressed in arbitrary units. |

