Visualization of tunnel magnetoresistance effect in single manganite nanowires*
Project supported by the National Key Research and Development Program of China (Grant No. 2016YFA0300702), Shanghai Municipal Natural Science Foundation, China (Grant Nos. 19ZR1402800, 18JC1411400, 18ZR1403200, and 17ZR1442600), the Program of Shanghai Academic Research Leader, China (Grant Nos. 18XD1400600 and 17XD1400400), and the China Postdoctoral Science Foundation (Grant Nos. 2016M601488 and 2017T100265).
Yu Yang1, Hu Wenjie1, Li Qiang1, Shi Qian1, Zhu Yinyan1, Lin Hanxuan1, Miao Tian1, Bai Yu1, Wang Yanmei1, Yang Wenting1, Wang Wenbin2, Guo Hangwen2, ‡, Yin Lifeng1, 2, 3, §, Shen Jian1, 2, 3, ¶
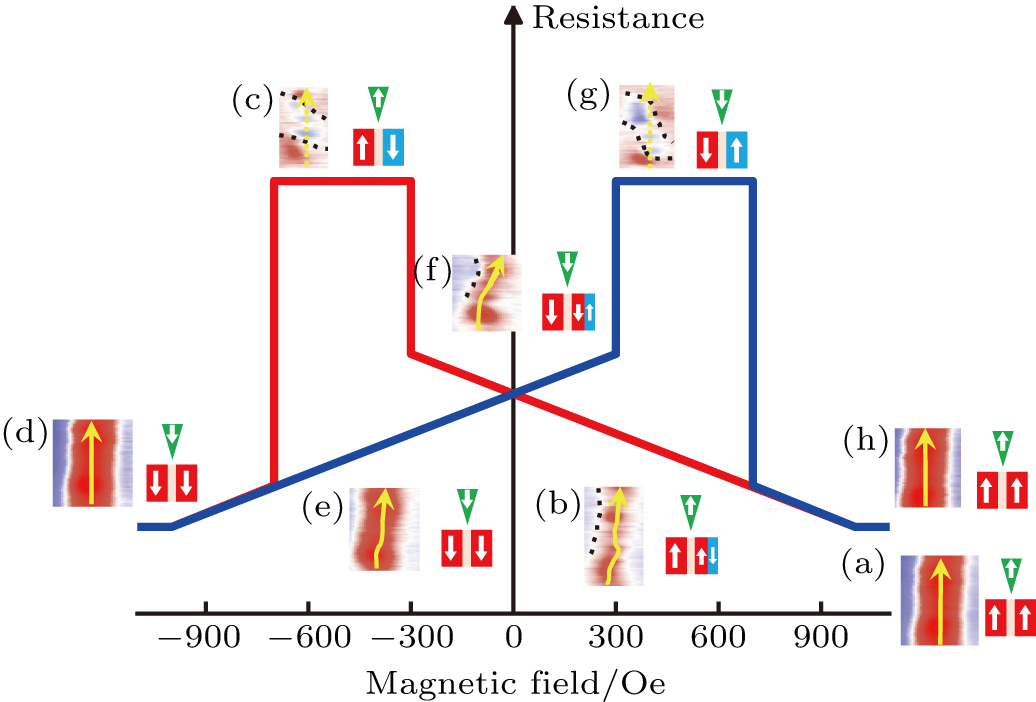
The schematic interpretation of TMR effect. (a)–(h) MFM images of the 500 nm LPCMO nanowire in the same area during the TMR process at 110 K on the sequence of (a) 1000 Oe, (b) 0 Oe, (c) −300 Oe, (d) −1000 Oe, (e) −300 Oe, (f) 0 Oe, (g) 300 Oe, (h) 1000 Oe from Fig. 3. The magnetic field was swept following the above order. The black dash lines in the MFM images represent the blockade between the nearby antiparallel magnetic domains. The solid yellow arrows represent the conducting path for electrons, and the dashed yellow arrows represent the tunneling of the electrons. The cartoon besides every MFM image shows the relative directions of MFM tip and magnetic domains. The red and blue curves represent the schematic of resistance states with magnetic field changing from 1000 Oe to −1000 Oe and −1000 Oe to 1000 Oe, respectively.