Electromagnetically induced transparency at optical nanofiber–cesium vapor interface
Liu Rui-Juan1, Su Dian-Qiang1, Song Zi-Xuan1, Ji Zhong-Hua1, 2, Zhao Yan-Ting1, 2, †
State Key Laboratory of Quantum Optics and Quantum Optics Devices, Institute of Laser Spectroscopy, Shanxi University, Taiyuan 030006, China
Collaborative Innovation Center of Extreme Optics, Shanxi University, Taiyuan 030006, China


† Corresponding author. E-mail: zhaoyt@sxu.edu.cn

Project supported by the National Key Research and Development Program of China (Grant No. 2017YFA0304203), the National Natural Science Foundation of China (Grant Nos. 61675120, 11434007, and 61875110), Project of the National Natural Science Foundation of China for Excellent Research Team (Grant No. 61121064), the Shanxi “1331 Project” Key Subjects Construction, PCSIRT, China (Grant No. IRT 17R70), and the 111 Project, China (Grant No. D18001).

Abstract

Optical nanofiber (ONF) is a special tool for effectively controlling coupling of light and atoms. In this paper, we study the ladder-type electromagnetically induced transparent (EIT) under ultralow power level in a warm cesium vapor by observing the transmission of ONF that couples the 6S → 6P Cs atoms in the presence of a 6P → 8S control beam through the same fiber. The linewidth and transmission of the EIT signal are investigated at different intensities of the control laser. In addition, we theoretically study the nonlinear interaction at the ONF interface using the multi-level density matrix equations, and obtain good agreements between theory and experiments. The results may have great significance for further study of optical nonlinear effect at low power level.

1. Introduction

Researchers have been working on how to realize the nonlinear photon–atom interaction at low power, a topic of great importance in both nonlinear optics[1] and quantum optics.[2,3] To enhance the nonlinear effects, the nonlinear optical polarization of matter can be enhanced by quantum interference. A famous example is electromagnetically induced transparency (EIT).[4] On the other hand, an efficient way to enhance the nonlinear effect of low light is to reduce the mode volume. Approaches toward this direction including confining light in waveguides and cavities, where photonic band-gap fiber, integrated waveguide or optical nanofiber (ONF) can achieve this characteristic very well.[512] There are also researches that combines the two methods, so as to explore quantum interference-enhanced nonlinear effects with confined light field.[13,14] In this work, we use nanofiber to study the EIT effect at ultralow power, which belongs to this category as well. Compared with other structures, the nanofiber can confine the light field more tightly in the surface of fiber, forming the tightly-confined evanescent optical mode interacting with surrounding atoms at long distance.[11,15] This property of ONF provides a new platform for studying nonlinear effects at ultralow power.

The electromagnetically induced transparency is a special nonlinear effect exhibited by the interaction between light and matter. The absorption of the weak probe field at the resonant frequency is reduced when a strong control field is used.[4,1618] The EIT effect can be widely used in four-wave mixing,[1921] all-optical switching,[22,23] slow light, and optical storage.[24,25] Recently, researchers have demonstrated EIT phenomenon in cold atoms ONF-based systems at ultralow power, and achieved the optical storage at the single photon level by the Λ-type EIT.[26,27]

In this paper, we use an ONF-based system with hot cesium (Cs) atomic vapor to study the three-level ladder-type EIT phenomenon at ultralow power. This system is simpler than the cold atom system, and we can still observe obvious EIT phenomenon with a few microwatts of the control laser. The probe laser field couples the transition of 6S1/2 → 6P3/2, and the control laser field couples the 6P3/2 → 8S1/2. The EIT spectrum with Doppler-broadened background is obtained by scanning the frequency of the probe laser and fixing the frequency of the control laser when both lasers propagating in opposite directions. The transmission and linewidth of the EIT window as a function of the control laser power are also investigated. To systematically study the EIT effect, we numerically simulate the EIT spectrum by solving the steady-state density-matrix equations and integrating over the atomic velocity distribution. The simulation results show a good agreement with the experimental measurements.

2. Experimental setup

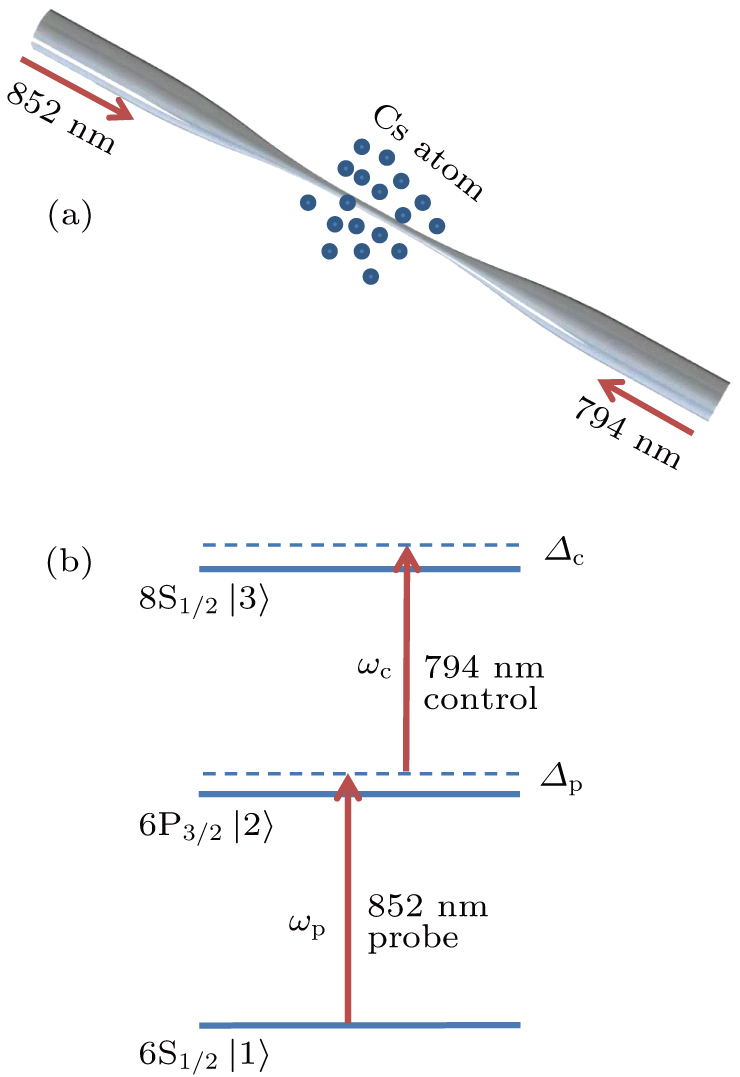
We use the “flame-brush” technique with a hydrogen–oxygen flame to produce ONFs from standard fiber (Fiber Core SM800 5.6/125).[28,29] The nanofiber for the experiment is composed of three parts: the input and output sections composed of a standard fiber, the 5-mm nanofiber regime with 500-nm diamter, and two tapered fiber regimes that smoothly connect the two parts. The simple structure of ONF is shown in Fig. 1(a). The guided optical mode of the ONF exhibits single mode guiding, tight radial confinement, as well as substantial evanescent field.[15] Compared with free space experiments that typically requires milliwatt laser power for the nonlinear experiment, in the ONF experiments, the small evanescent mode and long interaction length of nanofibers allow us to observe the nonlinear effects with a few picowatts powers.[26]

Fig. 1. (a) Optical nanofiber with 500-nm diameter and 5-mm length is surrounded by hot Cs atoms. (b) Schematic energy level of ladder-type EIT system. The 852-nm laser is the probe field and the 794-nm laser is the control field. Δp and Δc are the frequency detunings of the probe laser and the control laser, respectively.

In our system, ONF is mounted on a U-shaped bracket and placed in a vacuum system filled with Cs vapor, and release the atomic vapor by applying a current to the Cs dispenser. In order to reduce transmission losses due to the accumulation of atoms on the nanofiber surface, we maintain the fiber temperature with special heater element and keep the temperature of the fiber slightly higher than the vacuum chamber.[30] Figure 1(b) shows the schematic energy levels. The 852-nm probe field and 794-nm control field couple the 6S1/2 → 6P3/2 → 8S1/2 two-photon transition. When probe light resonates to 6S1/2 → 6P3/2 transition, the probe light is strongly absorbed due to the evanescent wave interaction with atoms. However, simultaneously, if the control laser is also resonant to 6P3/2 → 8S1/2, the probe absorption is obviously reduced, and thus the EIT effect happens. The two external cavity diode lasers are used to couple these transitions.

The schematic diagram of our experimental scheme is shown in Fig. 2. The 852-nm and 794-nm lasers are counter-propagating through the ONF. The counter-propagating geometry is applied in order to reduce the Doppler effect of the two-photon coupling. Both the 852-nm and 794-nm lasers pass through the neutral density filter (ND) and are split into two beams by 50/50 fiber splitter. By recording one of the 50/50 splitter output with a photodiode, the beam power for the experiment from the other output is continuously monitored. To observe the absorption signal of the probe beam, we use a photomultiplier tube (PMT). To provide a reference signal for the ONF experiments, part of an 852-nm laser is split by a polarization beam splitter (PBS) and enter a saturated absorption spectrum (SAS) setup. The power of two lasers can be controlled by the neutral density filter at the nanowatt level.

Fig. 2. Schematic diagram of the optical experimental setup: λ/2, half-wave plate; PBS, polarization beam splitter; ND, neutral density filter; PD, photodiode; filter, 852-nm bandpass filter; PMT, photomultiplier tube; SAS, saturated absorption spectrum. The probe and control lasers are counter-propagating through the ONF.
3. Experimental results and discussion

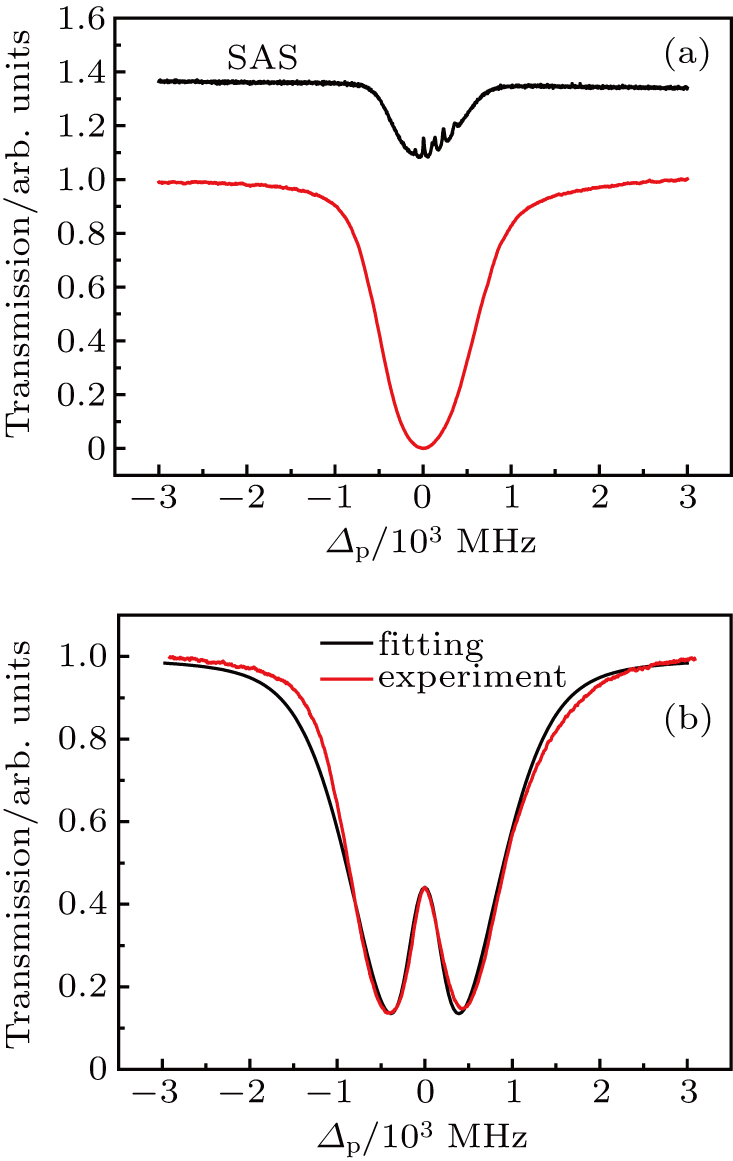
The red line in Fig. 3(a) indicates the {normalized absorption spectroscopy of the probe laser with a power of 1.5 nW in the nanofiber system, and the control laser is turned off. The frequency of the probe laser is scanned around the transition of |6S1/2, F = 4⟩ → |6P3/2, F′ = 5⟩ and detect by PMT. The black line in Fig. 3(a) shows the free-space SAS, which acted as a frequency reference. We gain the normalized EIT spectrum with Doppler-broadened background when the control laser with a power of 34.3 μW is locked at the transition of |6P3/2,F′ = 5 ⟩ → |8S1/2,F″ = 4⟩, as shown in Fig. 3(b) (the red line).

Fig. 3. (a) The normalized transmission spectrum of the probe laser in the absence of the control laser. The black line is the free-space SAS spectrum. (b) Experimental observation (red line) and theoretical simulation (black line) of EIT spectrum with Doppler-broadened background. The control laser frequency is fixed on resonance with a power of 34.3 μW.

To get a better understanding of physics behind this observation, we numerically solve the density matrix equation, taking into account the velocity distribution of atoms, and compare the numerically evaluated results with the experimental observations. Start from a three-level model as shown in Fig. 1(b), we apply rotating-wave approximation to the three-level Hamiltonian, leading to the density matrix equation as follows:[31,32] ρ11.=Γ2ρ22+iΩp(ρ21ρ12),ρ22.=Γ3ρ33Γ2ρ22+iΩp(ρ12ρ21)+iΩc(ρ32ρ23),ρ33.=Γ3ρ33+iΩc(ρ23ρ32),ρ12.=(γ12iΔp)ρ12iΩcρ13+iΩp(ρ22ρ11),ρ13.=[ γ13i(Δp+Δc) ]ρ13+iΩpρ23iΩcρ12,ρ23.=(γ23iΔc)ρ23+iΩpρ13+iΩc(ρ33ρ22). Here Δp = ωpω21 and Δc = ωcω32 are the detunings of the probe and control laser frequencies relative to the |1⟩ → |2⟩, |2⟩ → |3⟩ transitions respectively. Ωp = μ21Ep/ħ (Ωc = μ32Ec/ħ) is the Rabi frequency of the probe (control) field. Here μ21 and μ32 are the electric-dipole moment for transitions |1⟩ → |2⟩ and |2⟩ → |3⟩, respectively. Ep and Ec are the amplitude of the probe and control fields, respectively. The decay rate is determined by γij = (Γi + Γj)/2, and the Γi represents the natural decay rate of the energy level |i⟩.

In the weak probe limit, the matrix element ρ21 is obtained by solving the above equation with first-order perturbation approximation[31,32]

In our experiment, the probe laser and control laser are counter-propagating and the Doppler shift needs to be considered due to their large frequency difference. In the Doppler-broadened system, when the atom with velocity ν moves toward the probe laser, the detuning Δp of the probe laser should be substituted by Δp + ωpν/c and the detuning Δc of the control laser should be substituted by Δcωcν/c.[32] The absorption characteristic of the atomic medium is determined by the imaginary part of total susceptibility[31,32]

where ε0 is the permittivity of vacuum. We consider the contribution of all the velocity groups on the susceptibility, and N(ν) d ν = N0 exp (−ν2/μ2) is the number of atoms per unit volume with velocity ν. Here is the root-mean-square atomic velocity, N0 is the atomic number. Using the theoretical model above, we perform simulations of the EIT spectrum in the presence of the control laser. For the numerical parameters in our experiment, the natural decay rate of Γ2 is 5.22 MHz and that of Γ3 is 2.18 MHz,[33] and the frequency detuning Δc of control laser is set to be zero. We then integrate the imaginary part of χ(ν) over atomic velocity distribution, and obtain the results as a function of probe laser frequency detuning Δp, as shown in Fig. 3(b) (black line). The whole profile of the simulated curve is in good agreement with the EIT spectrum obtained in the experiment.

To investigate the effect of control power on the full width at half maximum (FWHM) and transmission intensity of EIT window, the different control powers are used and the probe power is fixed at 1.5 nW. The black dots with error bars in Fig. 4 are the standard deviation of five measurements. The black dots in Fig. 4(a) reveal that the FWHM (the linewidth obtained by fitting the experimental EIT transparent window using the Lorentz function) of EIT} gradually increases when the power of the control field increases. For further clarification about the variation of FWHM with the control power, we use the following formula[3436] to compare the theoretical result with the experimental observation

where is the dephasing rate for the upper level |3⟩ and lower level |1⟩, the decay rate . The square of Rabi frequency is proportional to the control power. We obtain the fitting curve as shown in Fig. 4(a) (red line). The fitting result shows that theoretical calculation is in good agreement with the experimental measurement, and the dephasing rate is deduced to be kHz.

Fig. 4. The black dots with error bars represent the influence of control intensity in the FWHM (a) and transmission (b) of EIT window. The red lines represent the theoretical curve. Both the FWHM and normalized transmission increase with the control laser power.

Figure 4(b) shows the dependence of normalized transmission (the ratio of the change in the zero-detuning probe transmission in the absence and presence of control laser) as a function of the control power. The increasing tendency of transmission with increasing control power is apparent. According to Eq. (3), we are able to calculate the absorption at the resonance Δp = Δc = 0, and to predict the change of normalized transmission with the control power. However, theoretical calculation will be very complicated when we take into account the small Doppler-shift of the two-photon transition. Equation (3) can be simplified by ignoring the Doppler broadening of the two-photon transition when the detuning Δp = Δc = 0, and obtain the following formula:[32]

The normalized transmission of EIT spectrum can be expressed by the Beer’s law, T = exp (−i χ · L), and the L is the interaction length between light and atoms. Using Eq. (5) and Beer’s law, the experimental data of the transmission are fitted and shown in Fig. 4(b) (red line). The experimentally measured transmissions fit well with the expression, confirming the validity of the simple effective theory to this experiment.

4. Conclusion

In conclusion, we study the three-level ladder-type EIT effect using a nanofiber–Cs vapor interface in the presence of Doppler-broadened and using very low-power probe and control laser beams. We use density matrix equations to numerically reproduce the experimental observations, showing fairly good agreements between the simple theory and experimental observations. The benefit of light confinement in ONF should allow other type of nonlinaer optical experiments, in addition to the ladder-type EIT as in this work. This study may also contribute to realization of EIT-based low-light level optical switch and optical memory.

Reference
[1] Shen Y R 1984 The Principles of Nonliner Optics New York Wiley-Interscience 575
[2] Chiu C K Chen Y H Chen Y C Yu I A Chen Y C Chen Y F 2014 Phys. Rev. 89 023839
[3] Vukovic N Healy N Suhailin F H Mehta P Day T D Badding J V Peacock A C 2013 Sci. Rep. 3 2885
[4] Harris S E Field J E Imamoğlu A 1990 Phys. Rev. Lett. 64 1107
[5] Almeida V R Barrios C A Panepucci R R Lipson M 2004 Nature 431 1081
[6] Ghosh S Bhagwat A R Renshaw C K Goh S Gaeta A L Kirby B J 2006 Phys. Rev. Lett. 97 023603
[7] Yang W Conkey D.B Wu B Yin D L Hawkins A R Schmidt H 2007 Nat. Photon. 1 331
[8] Spillane S M Pati G S Salit K Hall M Kumar P Beausoleil R G Shahriar M S 2008 Phys. Rev. Lett. 100 233602
[9] Sprague M R Michelberger P S Champion T F M England D G Nunn J Jin X M Kolthammer W S Abdolvand A Russell P St J Walmsley I A 2014 Nat. Photon. 8 297
[10] Ritter R Gruhler N Pernice W Kübler H Pfau T Löw R 2015 Appl. Phys. Lett. 107 041101
[11] Solano P Grover J A Hoffman J E Ravets S Fatemi F K Orozco L A Rolston S L 2017 Adv. At. Mol. Opt. Phys. 66 439
[12] He Y Ma Y F Tong Y Peng Z F Yu X 2018 Acta Phys. Sin. 67 020701 in Chinese
[13] Ghosh S Sharping J E Ouzounov D G Gaeta A L 2005 Phys. Rev. Lett. 94 093902
[14] Xu J Huang G 2013 Opt. Express 21 5149
[15] Garcia-Fernandez R Alt W Bruse F Dan C Karapetyan K Rehband O Stiebeiner A Wiedemann U Meschede D Rauschenbeutel A 2011 Appl. Phys. 105 3
[16] Fleischhauer M Imamoglu A Marangos J P 2005 Rev. Mod. Phys. 77 633
[17] Sargsyan A Petrov P A Vartanyan T A Sarkisyan D 2016 Opt. Spectrosc. 120 339
[18] Simons M T Gordon J A Holloway C L Anderson D A Miller S A Raithel G 2016 Appl. Phys. Lett. 108 174101
[19] Geng J Campbell G T Bernu J Higginbottom D B Sparkes B M Assad S M Zhang W P Robins N P Lam P K Buchler B C 2014 New J. Phys. 16 113053
[20] Liu Z Y Xiao J T Lin J K Wu J J Juo J Y Cheng C Y Chen Y F 2017 Sci. Rep. 7 15796
[21] Wang Z G Cheng L Zhang Z Y Che J L Qin M Z He J N Zhang Y P 2013 Chin. Phys. Lett. 30 024203
[22] He Y Wang T Yan W Li X M Dong C B Tang J Liu B 2014 J. Mod. Opt. 61 403
[23] Albert M Dantan A Drewsen M 2011 Nat. Photon. 5 633
[24] Nakanishi T Kitano M 2018 Appl. Phys. Lett. 112 201905
[25] Hsiao Y F Tsai P J Chen H S Lin S X Hung C C Lee C H Chen Y H Chen Y F Yu I A Chen Y C 2018 Phys. Rev. Lett. 120 183602
[26] Gouraud B Maxein D Nicolas A Morin O Laurat J 2015 Phys. Rev. Lett. 114 180503
[27] Sayrin C Clausen C Albrecht B Schneeweiss P Rauschenbeutel A 2015 Optica 2 353
[28] Jones D E Franson J D Pittman T B 2015 Phys. Rev. 92 043806
[29] Ward J M Maimaiti A Le Vu H Nic Chormaic S 2014 Rev. Sci. Instrum. 85 111501
[30] Lai M M Franson J D Pittman T B 2013 Appl. Opt. 52 2595
[31] Yang X H Sheng J T Xiao M 2011 Phys. Rev. 84 043837
[32] Gea-Banacloche J Li Y Q Jin S Z Xiao M 1995 Phys. Rev. 51 576
[33] Chang R Y Lee Y C Fang W C Lee M T He Z S Ke B C Tsai C C 2010 J. Opt. Soc. Am. B 27 85
[34] Ye C Y Zibrov A S 2002 Phys. Rev. 65 023806
[35] Javan A Kocharovskaya O Lee H Scully M O 2002 Phys. Rev. 66 013805
[36] Wang B Li S Yao J Ma J Peng F Jiang G Wang H 2005 Chin. Opt. Lett. 3 486