Theoretical analyses of stock correlations affected by subprime crisis and total assets: Network properties and corresponding physical mechanisms
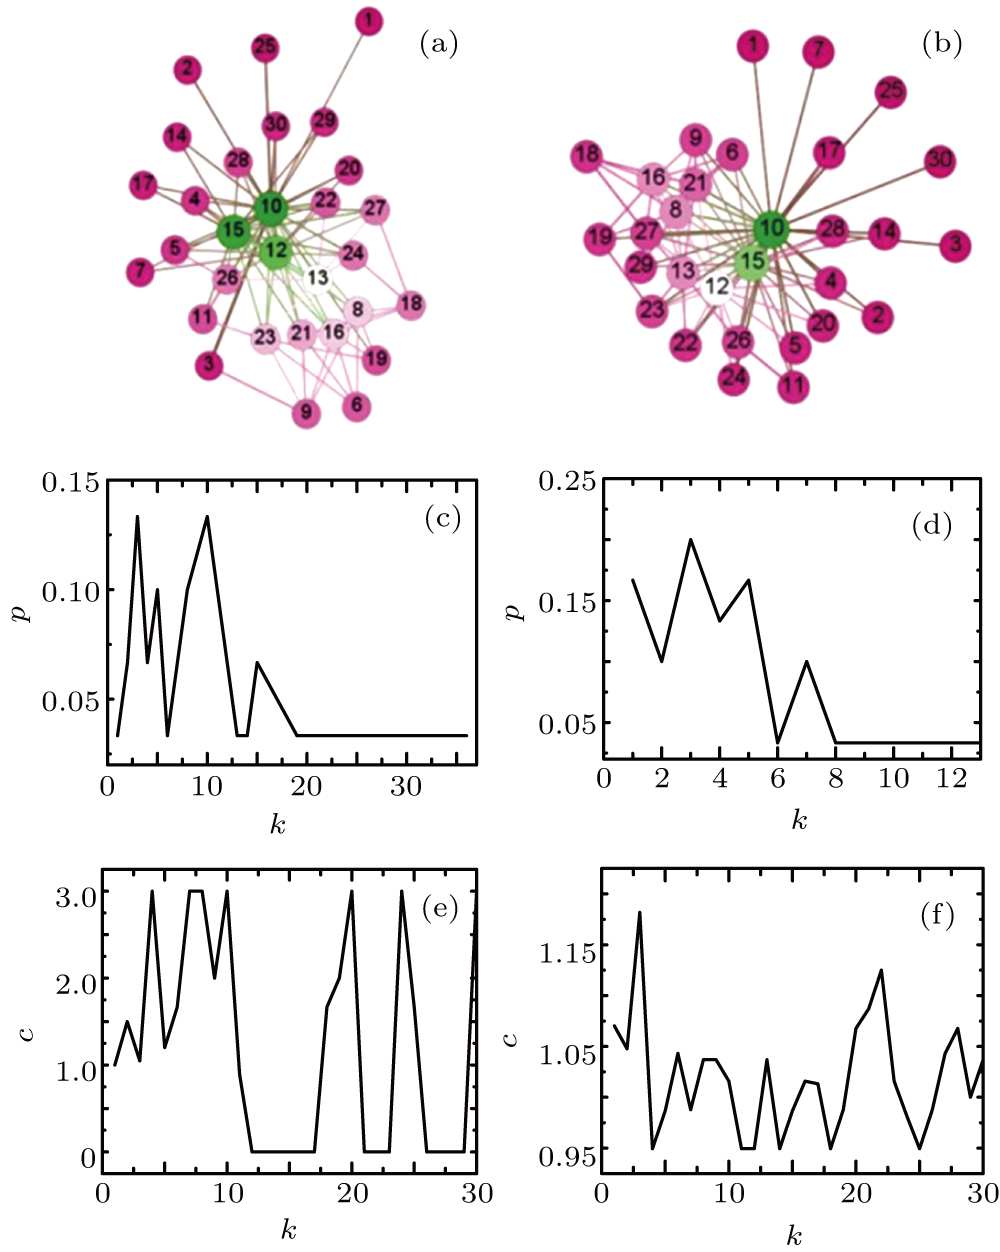
PMFG graphs and corresponding properties of these networks based on empirical data of 30 Asian stocks. (a) PMFG graph of these mentioned 30 Asian stocks during pre-subprime crisis (from August 2006 to September 2007), (b) PMFG graph of these mentioned 30 Asian stocks at the peak of subprime crisis (from October 2007 to November 2008), (c) degree distribution of network (a), (d) degree distribution of network (b), (e) clustering coefficient of network (a), and (f) clustering coefficient of network (b). Parameters k, p, and c denote degree, cumulative probability, and clustering coefficient, respectively. Green nodes mean core nodes of PMFG graphs. Rank of correlation among stocks is arranged as green, white, and violet.
