Theoretical analyses of stock correlations affected by subprime crisis and total assets: Network properties and corresponding physical mechanisms
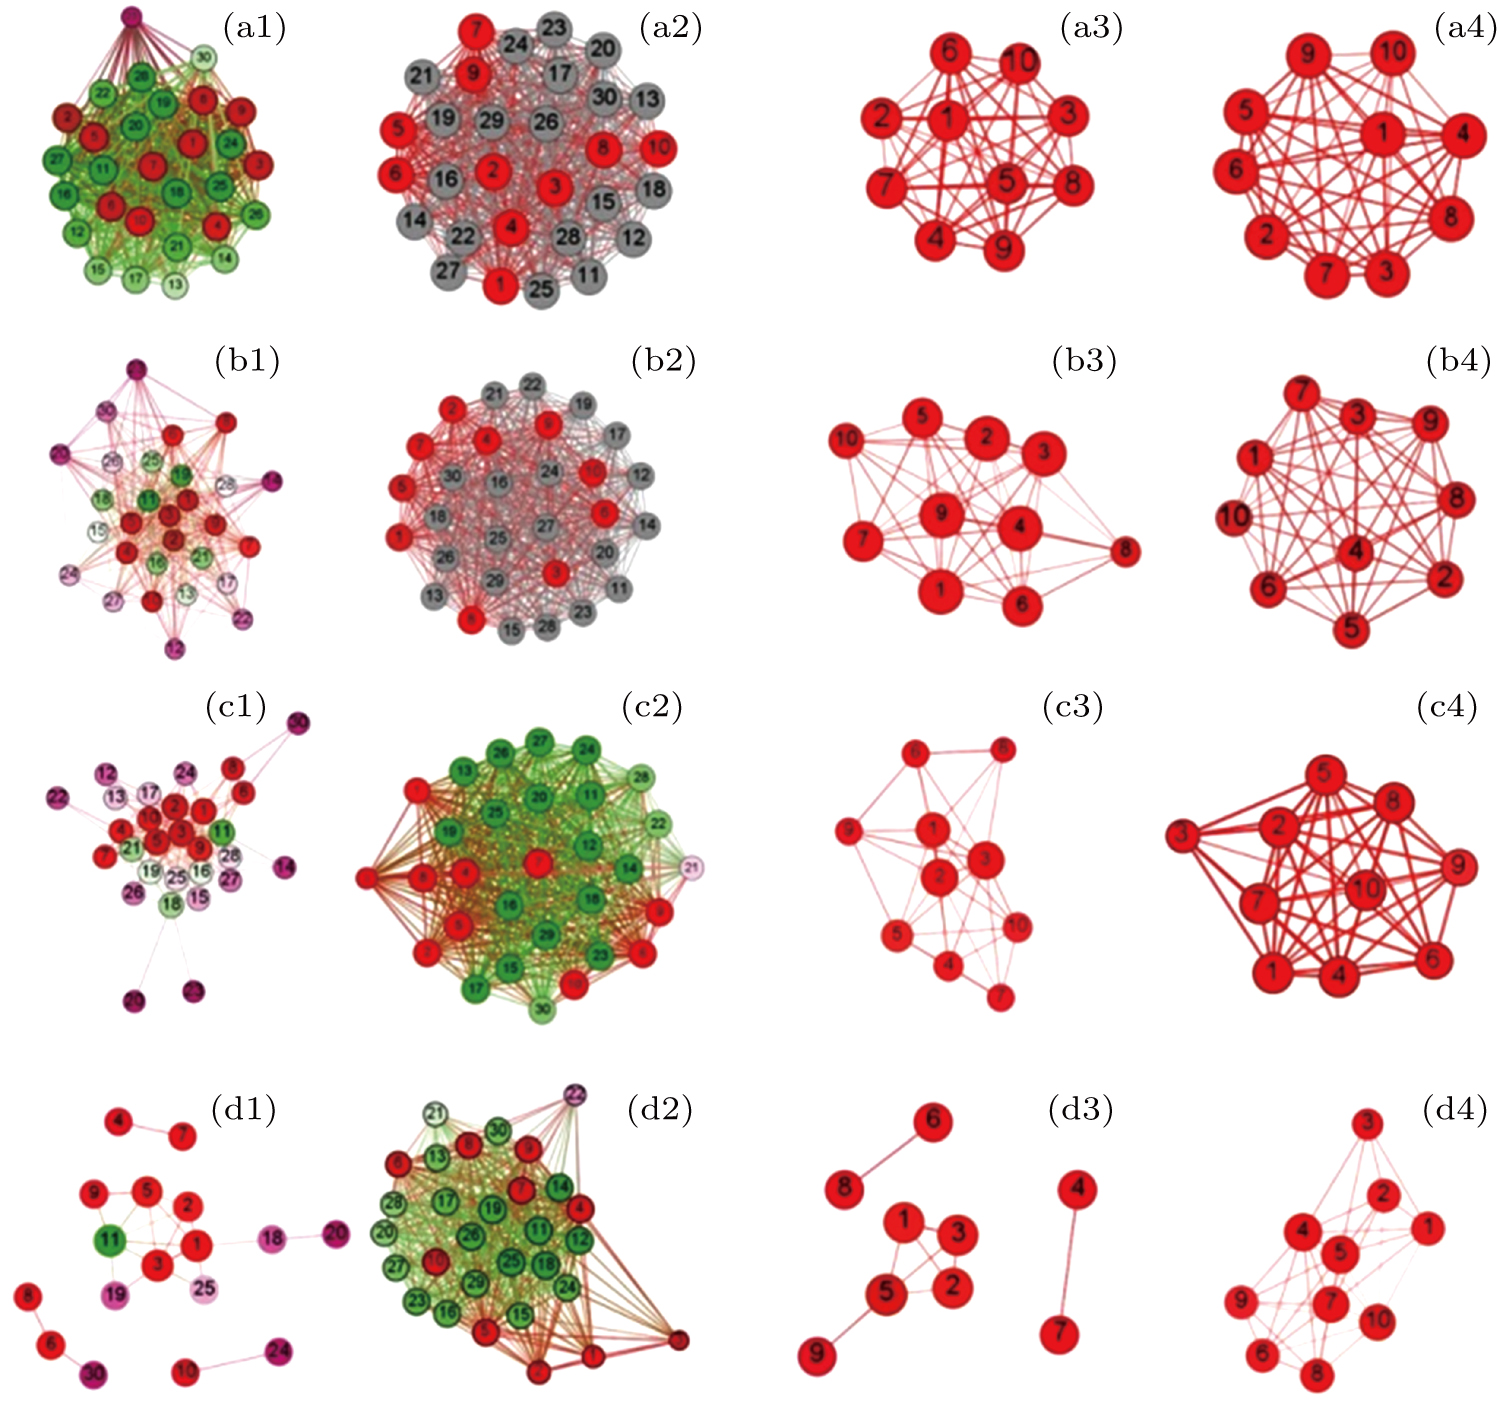
Threshold networks extracted from 30 Asian stocks for threshold of (a) 0.2. (b) 0.3, (c) 0.4, and (d) 0.5. Panels (a1), (b1), (c1), and (d1) correspond to the period of the pre-subprime crisis (from August 2006 to September 2007), and panels (a1), (b1), (c1), and (d1) correspond to the peak of subprime crisis (from October 2007 to November 2008). Panels (a3) and (a4) are extracted from panels (a1) and (a2), respectively. Similarly, panels (b3) and (b4) are extracted from panels (b1) and (b2), respectively. Panels (c3) and (c4) are extracted from panels (c1) and (c2), respectively. Panels (d3) and (d4) are extracted from panels (d1) and (d2), respectively. Red nodes correspond to focused 10 Asian stocks extracted from emphasized 30 stocks according to the order of the rank of the total asset of stocks. Symbols 1–10 correspond to top 10 stocks whose total assets are much higher than others’. Different colors of nodes correspond to different magnitudes of correlation among stocks. Rank of correlation among stocks is arranged as red, grey, green, white, and violet.