Theoretical analyses of stock correlations affected by subprime crisis and total assets: Network properties and corresponding physical mechanisms
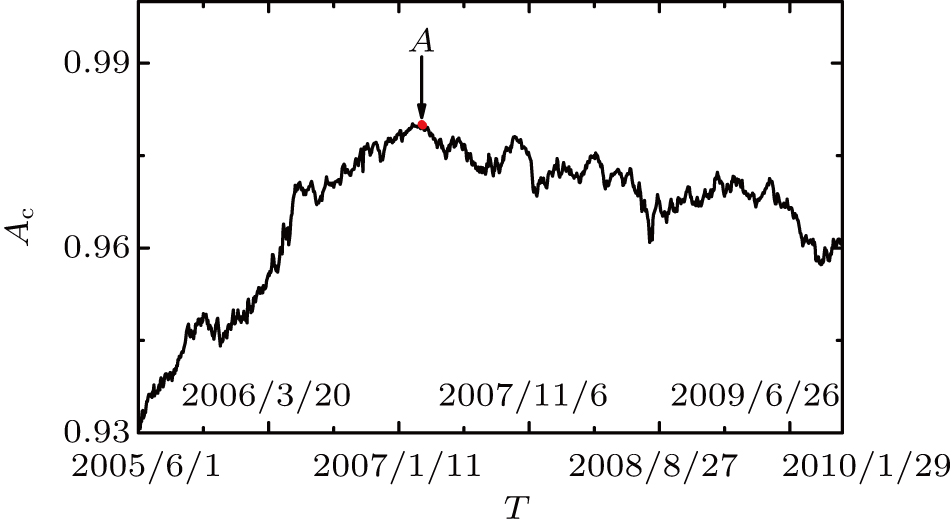
Evolution of average cross-correlation Ac with time T, with considering different stages ranging from regular time (June 2005–July 2006) to latter stage of subprime crisis (December 2008–January 2010). Symbol A shown by the red point corresponds to the peak of subprime crisis. Time point of A corresponds to March 27, 2007.