Theoretical analyses of stock correlations affected by subprime crisis and total assets: Network properties and corresponding physical mechanisms
Zhu Shi-Zhao1, Wang Yu-Qing2, ‡, Wang Bing-Hong1, 3, §
       

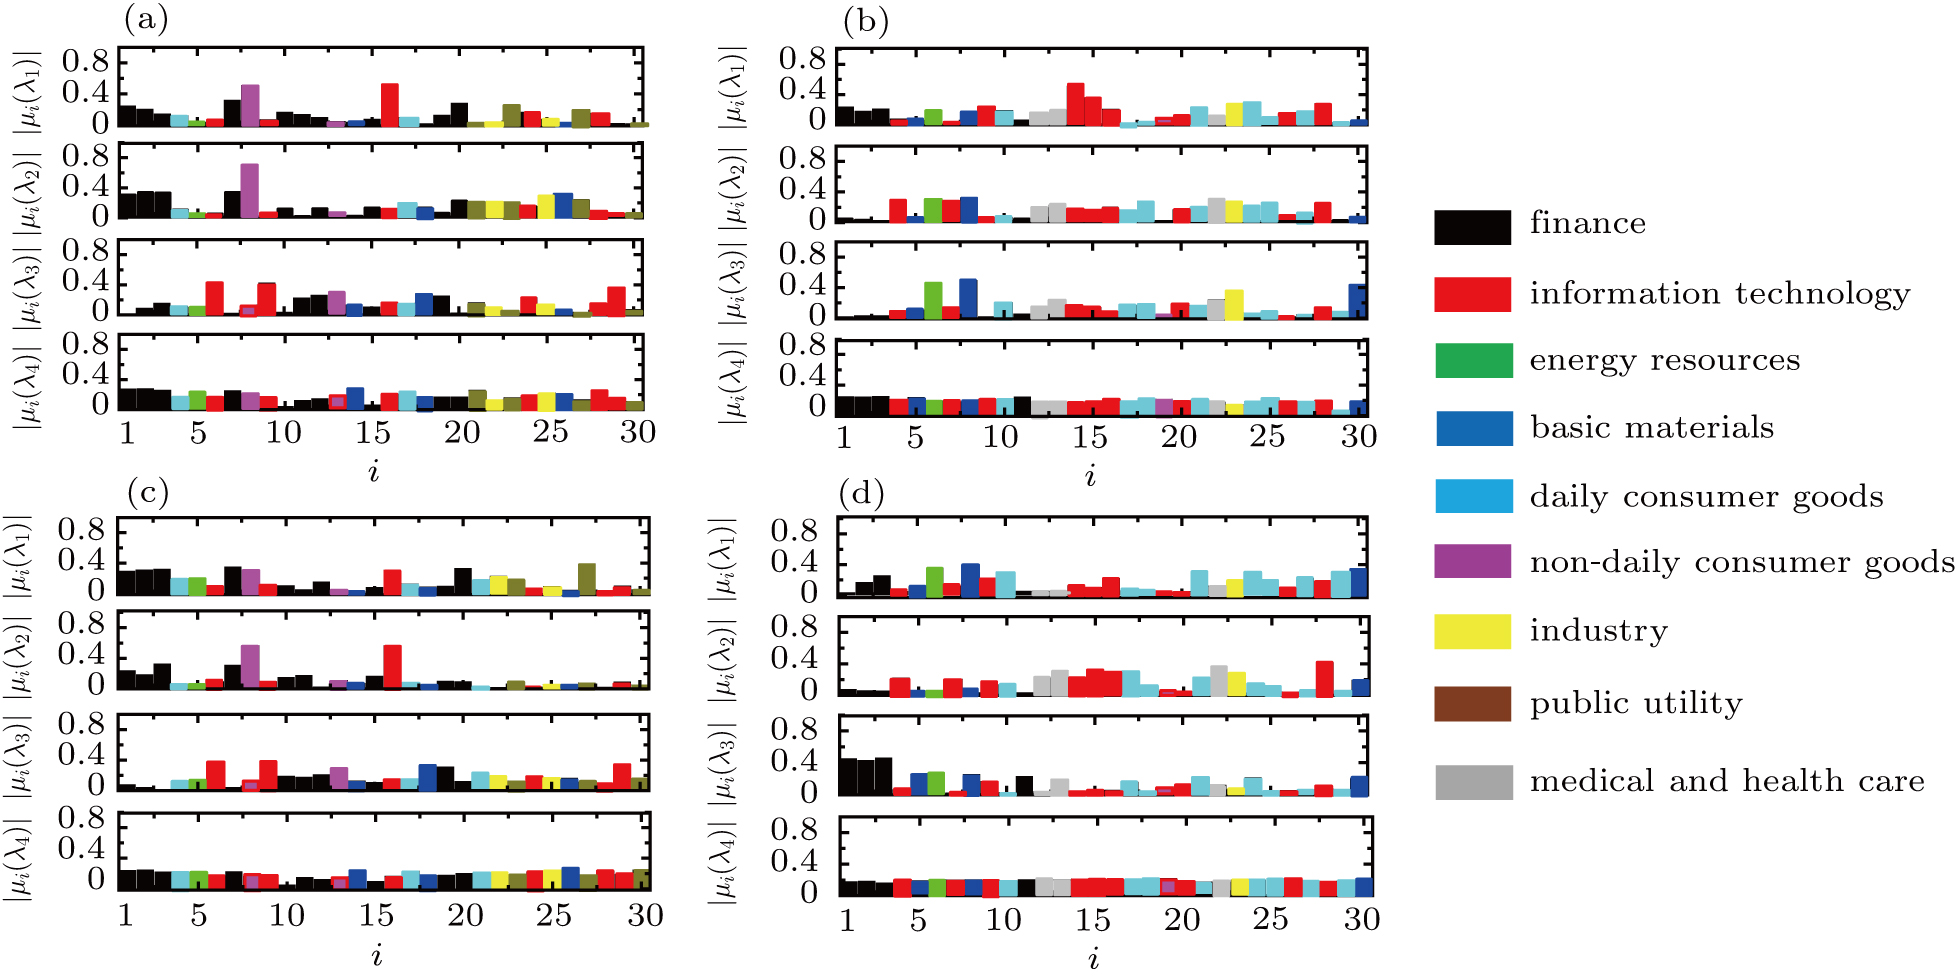
Moduli of components μ i ( λ j ) of the last four eigenvalues for (a) focused Asian stocks during pre-subprime crisis (from August 2006 to September 2007), (b) focused American stocks during pre-subprime crisis, (c) focused Asian stocks in the peak of subprime crisis (from October 2007 to November 2008), and (d) focused American stocks in the peak of subprime crisis. Stocks are arranged in order of total assets from major assets to minor ones, from 1 to 30, corresponding to the stock information in Tables 1 and 2. Symbol i refers to the stock number ranging from 1 to 30. Nine different colors correspond to various industrial sectors.