Theoretical analyses of stock correlations affected by subprime crisis and total assets: Network properties and corresponding physical mechanisms
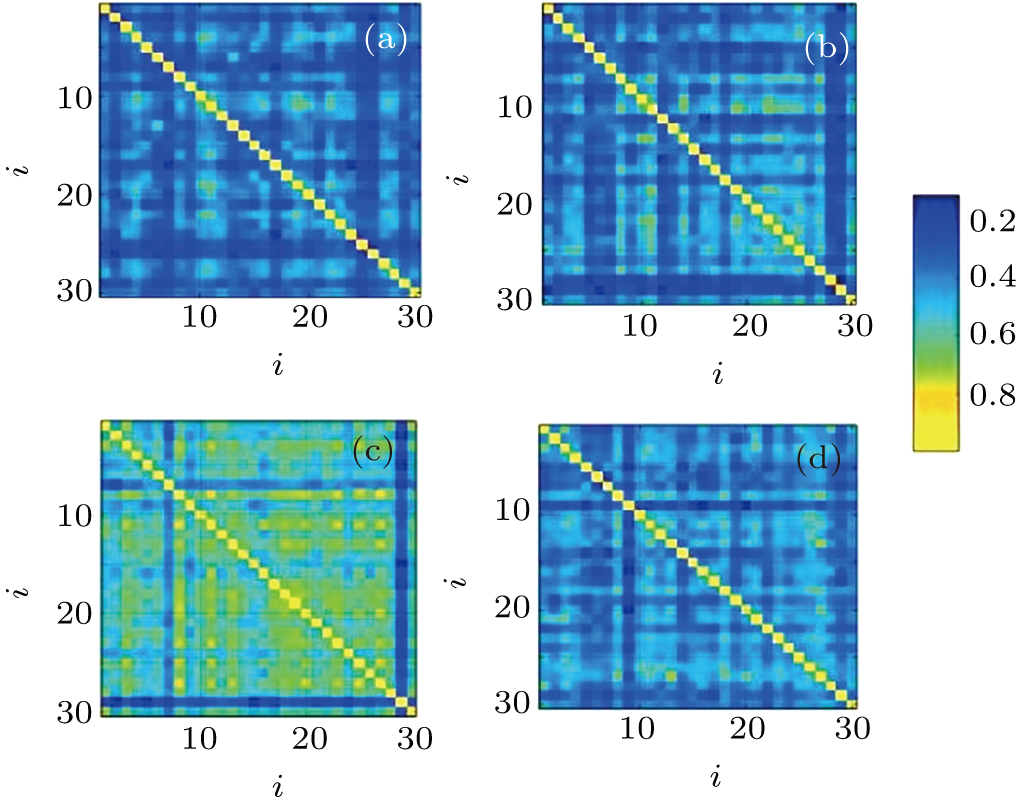
Correlation coefficients of focused 30 stocks in Asia. (a) Correlation coefficient in regular time (from June 2005 to July 2006). (b) Correlation coefficient in pre-subprime crisis (from August 2006 to September 2007). (c) Correlation coefficient in peak of subprime crisis (from October 2007 to November 2008). (d) Correlation coefficient in latter stage of subprime crisis (from December 2008 to January 2010). Stocks are arranged in order of total assets from major assets to minor ones. Here, symbol i refers to stock number ranging from 1 to 30, which also corresponds to the detailed information about stocks shown in Table