Quantitative heterogeneity and subgroup classification based on motility of breast cancer cells
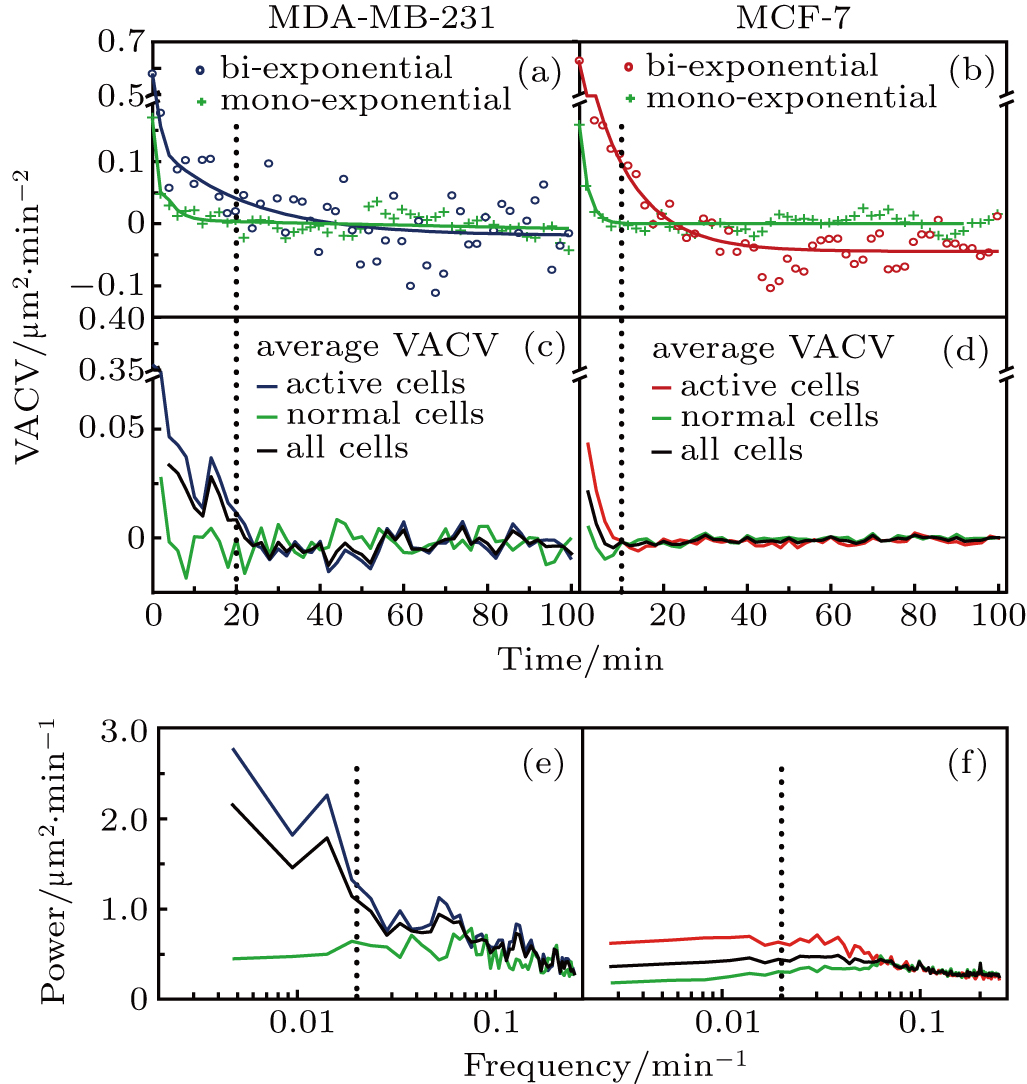
Differentiation of active cells from normal cells by VACVs. (a) and (b) Typical VACV trajectories of individual MDA-MB-231 and MCF-7 cells: active cells (blue or red circles) and normal cells (green crosses), and the fitting curves (solid lines). (c) and (d) Comparison between active and normal cells in EGF+ medium: average VACVs of active cells (red or blue) and normal cells (green), compared to average VACV (black) of all cells, for MDA-MB-231 and MCF-7 cells, respectively. (e) and (f) Corresponding power spectra for MDA-MB-231 and MCF-7 cells. These VACVs and power spectra show similar trends for normal cells of both cell-lines.
