Quantitative heterogeneity and subgroup classification based on motility of breast cancer cells
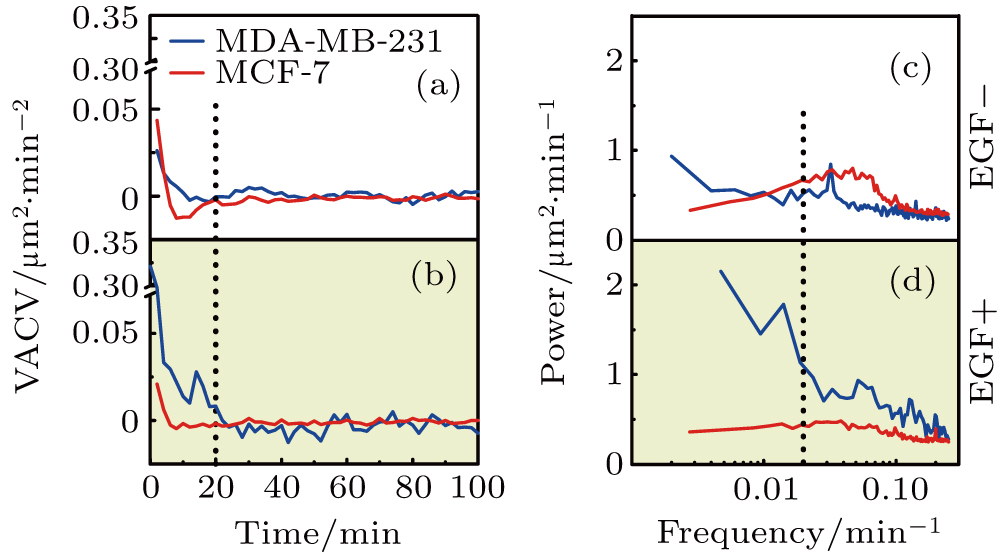
Velocity auto-covariance (VACVs) and power spectra of two breast cancer cell-lines. (a) and (b) Average VACVs of MDA-MB-231 (blue) and MCF-7 (red) cells in two medium conditions, as indicated. The dashed line refers to t = 20 min. (c) and (d) The corresponding power spectra of MDA-MB-231 (blue) and MCF-7 (red) cells. Higher power in the low frequency part of the spectra is found for MDA-MB-231 cells in two medium conditions, and its highest power spectrum is found in EGF+ medium. The dashed line highlights the frequency of 0.02 min−1, which is referred to as the low frequency region in the discussion.