† Corresponding author. E-mail:
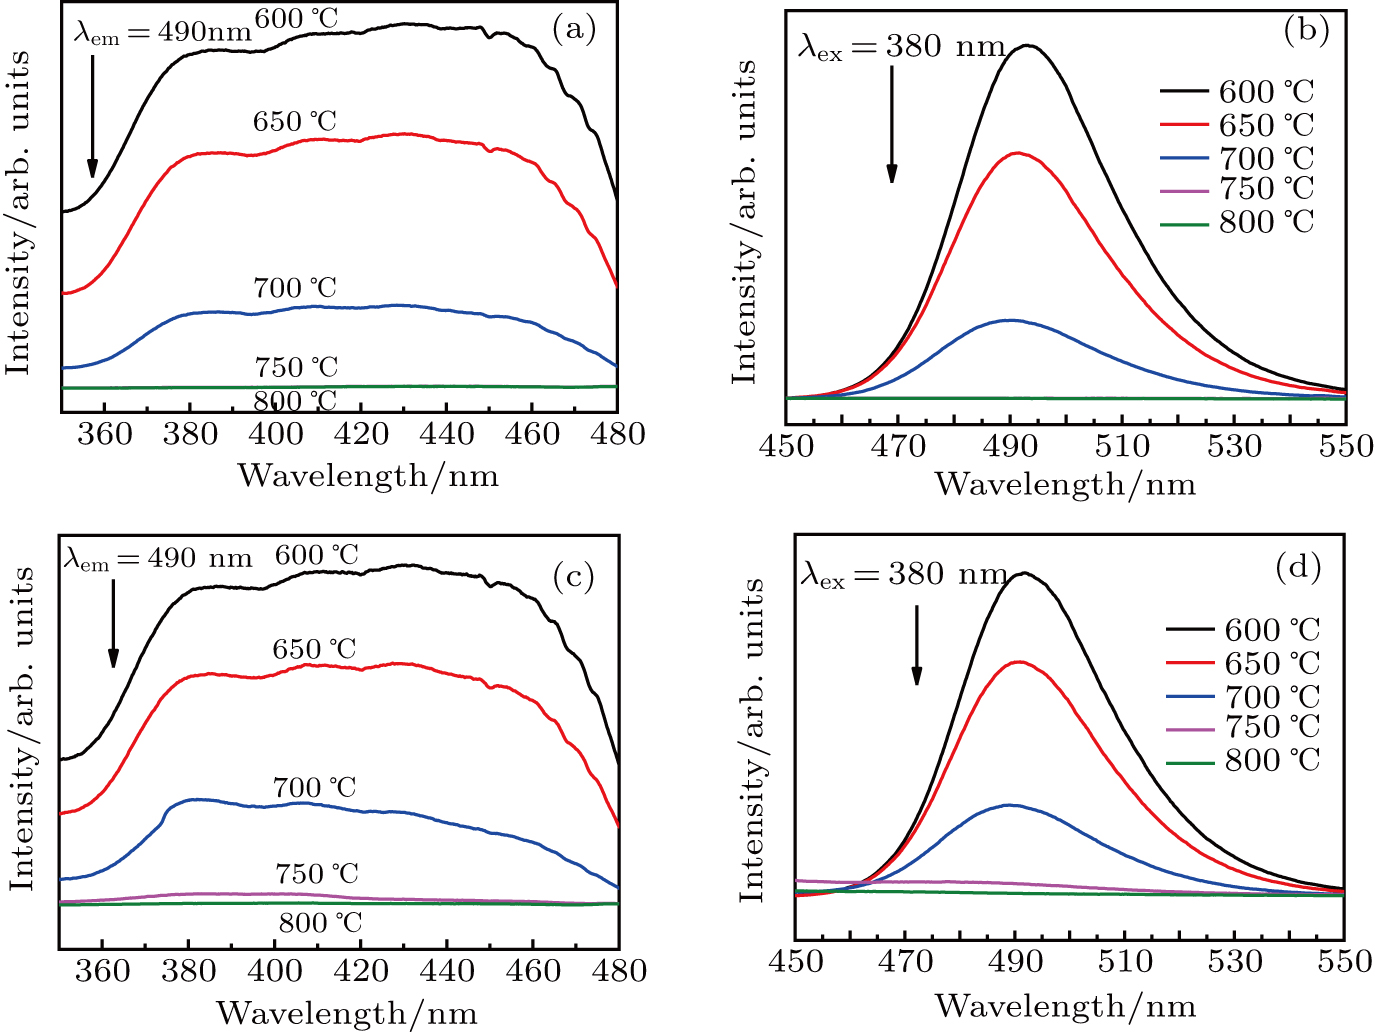
The color conversion glass ceramics which were made of borosilicate matrix co-doped (SrBaSm)Si2O2N2: (Eu3+Ce3+) blue–green phosphors were prepared by two-step method in co-sintering. The change in luminescence properties and the drift of chromaticity coordinates (CIE) of the (SrBaSm)Si2O2N2: (Eu3+Ce3+) blue–green phosphors and the color conversion glass ceramics were studied in the sintering temperature range from 600 °C to 800 °C. The luminous intensity and internal quantum yield (QY) of the blue–green phosphors and glass ceramics decreased with the sintering temperature increasing. When the sintering temperature increased beyond 750 °C, the phosphors and the color conversion glass ceramics almost had no peak in photoluminescence (PL) and excitation (PLE) spectra. The results showed that the blue–green phosphors had poor thermal stability at higher temperature. The lattice structure of the phosphors was destroyed by the glass matrix and the Ce3+ in the phosphors was oxidized to Ce4+, which further caused a decrease in luminescent properties of the color conversion glass ceramics.
Under the condition that energy is getting scarce, white light-emitting diodes (WLEDs) have attracted extreme attention in various fields because of their high efficiency, energy saving, shock resistance, long lifetime, environmental friendliness, and fast response.[1–7] However, with the development of technology, WLEDs with only high-power performance can no longer meet the market demand. Full-spectrum WLEDs have been exploited for their similar luminescence properties to the sunlight, which have higher color rendering index, higher light efficiency, and stronger color reproduction capability, can also solve the problem of excessive blue light damage.[8–12] Compared with general WLEDs, the full-spectrum WLED is usually synthesized by adding phosphors of 490 nm and 660 nm to complement short-wave blue–green light and long-wave red light, so that the spectral wavelength covers the entire visible light.[13–15] At present, phosphors with a wavelength of 660 nm have been extensively studied.[16–20] Therefore, the blue–green phosphor in the 490-nm band is a key issue in the research and preparation of full-spectrum LEDs. Currently, some blue–green phosphors, for example silicate (M2SiO4: Eu2+, M = Ca, Ba, Sr), sulfide (M2BS4: Eu2+, M=Ba, Sr, Ca, B=Al, Ga, In) aluminate (MSrAl37: Eu2+, M=Y, La, Gd), have been developed. However, the traditional silicate system has the narrow emission peak and the poor color rendering, the conventional sulfide phosphors usually have poor stability, sensitivity to environmental moisture and atmosphere, the aluminate is difficult to prepare, the cost is high and hydrolysis is easy to occur.[21–23] Oxynitride-based phosphors system[24,25] like (SrBaSm)Si2O2N2: (Eu3+Ce3+) blue–green phosphor materials have great value in research, because it possesses many advantages such as high luminous efficiency, effective excitation by visible light, high designability of fluorescence characteristics (wide adjustment range), high thermal stability, and environmental friendliness. Otherwise, the process technology of package full spectrum WLEDs also needs to overcome the easy aging and yellowing of silicone.[26–28] At home and abroad, lots of works of color conversion glass ceramics for white LEDs had been done.[29–32] At present, the glass material used in the color conversion glass ceramic research mainly include: bismuthate glass matrix material,[33] tellurate glass matrix material,[34] and borosilicate glass matrix material.[35] Compared to the other two glass matrix material, the borosilicate glass matrix material has two main advantages: (i) The borosilicate glass matrix material has a good thermal stability and prevents the phosphor from failing under high temperature and high humidity, (ii) The borosilicate glass matrix material is relatively stable, which can realize the glass ceramics with multi-wavelength phosphor doping. Therefore, it is necessary to study properties of borosilicate matrix blue–green color conversion glass ceramics.[36,37]
In this study, at the sintering temperature of 600 °C–800 °C, the borosilicate glass matrix and blue–green phosphors were co-sintered into color conversion glass ceramics, and the holding time was 20 minutes. The effect of sintering temperature on the luminescence properties of borosilicate matrix blue–green color conversion glass ceramics was studied. We can judge the luminescent properties of blue–green color conversion glass ceramics by the change of photoluminescence (PL) intensity at each sintering temperature. Moreover, the lattice structure of phosphors and glass ceramics at various sintering temperatures can be investigated by x-ray diffraction (XRD) and the content and variation of Ce3+ and Eu3+ can be measured by x-ray photoelectron spectrum analyzer to investigate the properties of color conversion glass ceramics at high sintering temperature.
In this process, the blue–green color conversion glass ceramics can be obtained by a two-step method in low-temperature co-sintering. Firstly, the weighed and mixed medicine which was made up of H3BO3, SiO2, ZnO, BaCO3, Na2CO3 for firing the glass matrix was sintered in a muffle furnace at 1100 °C for 1 h. Secondly, the transparent high-temperature liquid taken out from the muffle furnace was cooled on a copper plate at room temperature. Thirdly, the ground glass matrix powders with a d50 of 

The lattice structure of the prepared sample can be characterized by x-ray diffraction (XRD, Rigaku, Ultima IV, Japan) over a 2θ range between 10° and 80° with Cu 
We can observe the PLE and PL spectra of the (SrBaSm)Si2O2N2: (Eu3+Ce3+) blue–green phosphors and color conversion glass ceramics sintered at 600 °C–800 °C for 20 min from Fig.
Figure
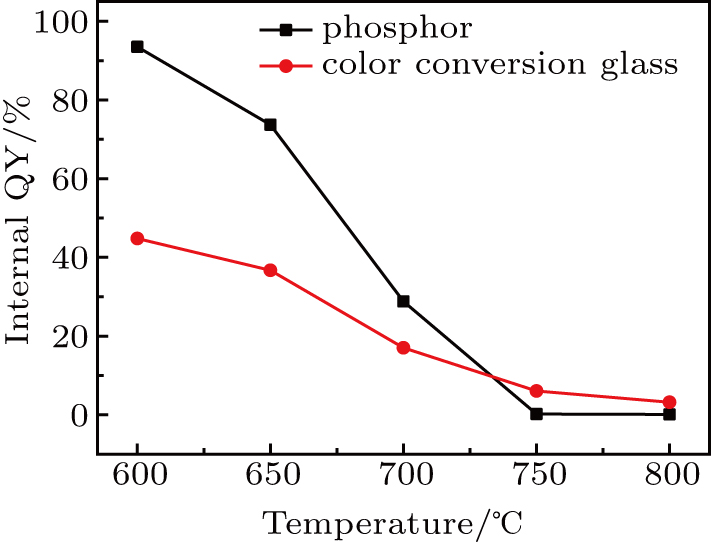 | Fig. 2. Internal QY diagram of the blue–green phosphors and glass ceramics at different sintering temperatures. |
In order to further confirm the regular pattern of the change of the luminescent properties of glass ceramics with the increase of the sintering temperature, the CIE coordinates at different sintering temperatures of glass ceramics and phosphors are shown in Fig.
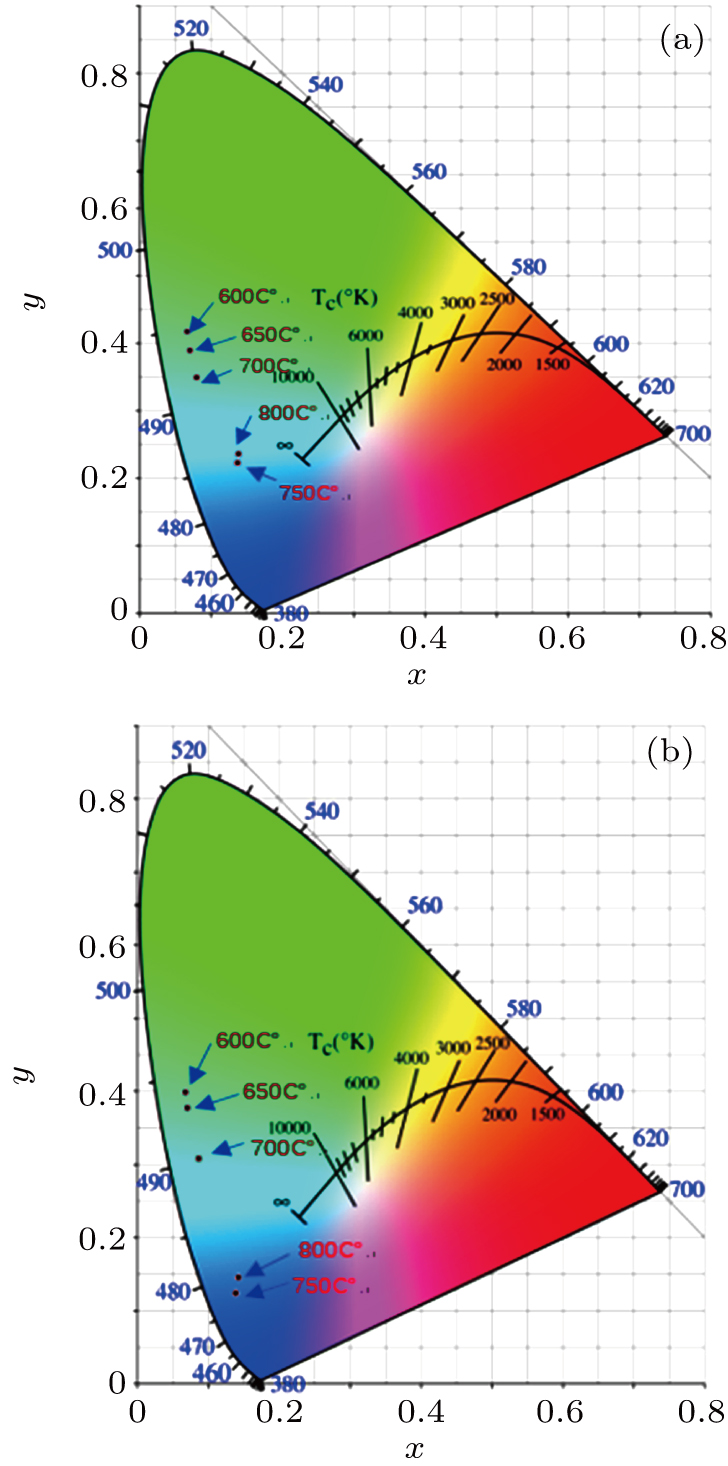 | Fig. 3. CIE coordinates diagram of blue–green phosphors and glass ceramics at various sintering temperatures: (a) CIE of phosphors, (b) CIE of glass ceramics. |
In order to more intuitively describe the variation of x axis and y axis of the CIE coordinates of (SrBaSm)Si2O2N2: (Eu3+Ce3+) color conversion glass ceramics and phosphors with increasing sintering temperature, it can be seen that the variable values of x and y in CIE coordinates at different sintering temperatures between color conversion glass ceramics and phosphors are in the range of 600 °C–800 °C as shown in Fig.
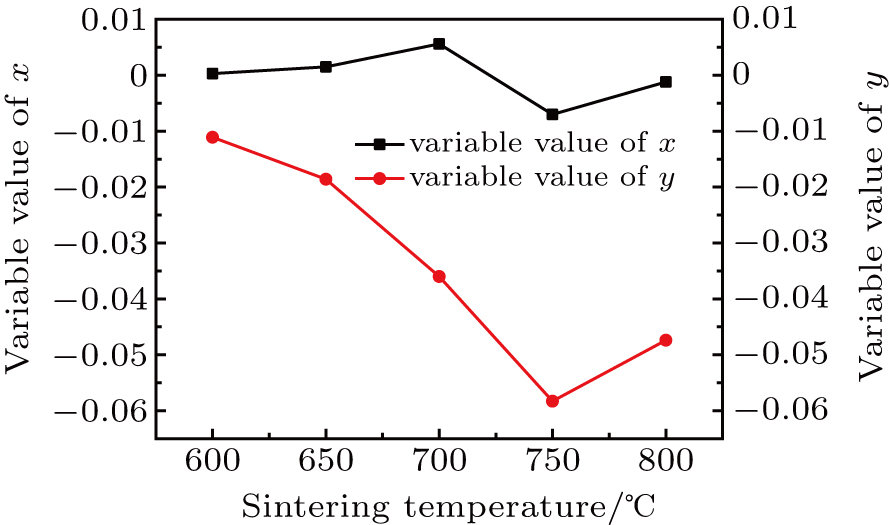 | Fig. 4. The variable values of x and y in CIE coordinates at different sintering temperatures between color conversion glass ceramics and phosphors in the range of 600 °C–800 °C. |
As reported in literature,[42–46] Since Eu3+ has one couple of adjacent thermally coupled energy levels TCL, 5D1 and 5D0, which are populated by the nonradiative relaxation, the phosphors were thermally quenched significantly at high sintering temperature, resulting in failure of the phosphor. This is the main reason for the weakening of the PL and PLE intensities of the (SrBaSm)Si2O2N2: (Eu3+Ce3+) blue–green phosphors.
In order to further study the reasons for the failure of luminescence performances for color conversion glass ceramics at higher sintering temperature, XRD patterns of phosphors and color conversion glass ceramics at different sintering temperatures in Fig.
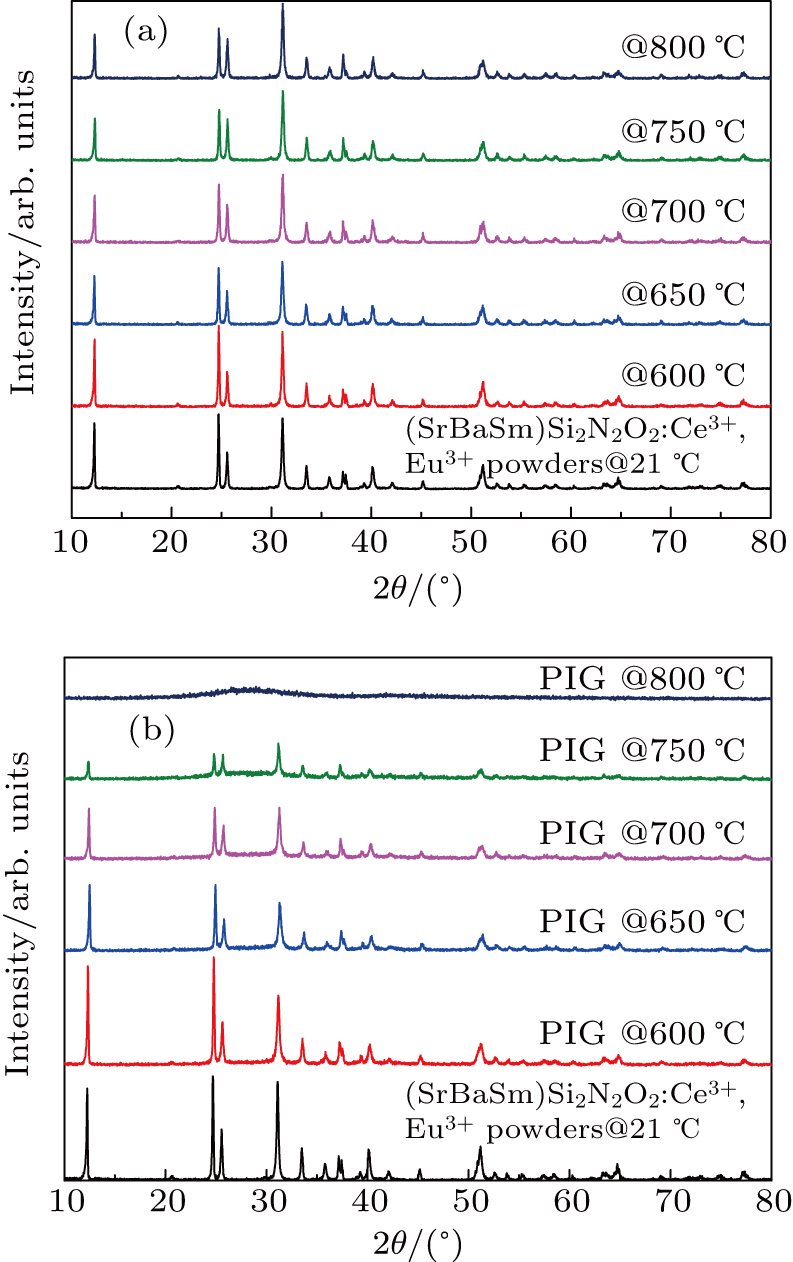 | Fig. 5. XRD patterns of phosphors and color conversion glass ceramics at different sintering temperatures: (a) XRD of phosphors, (b) XRD of glass ceramics. |
The values of binding energies for Ce3+3d5/2, Ce3+3d3/2, Eu3+3d5/2, and Eu3+3d3/2 are 884, 902, 1135.1, and 1664.3 eV respectively which are queried from the standard XPS map database, while the binding energies of Ce4+3d5/2 and Ce4+3d5/2 are 881.6 eV and 899.9 eV respectively. Figure
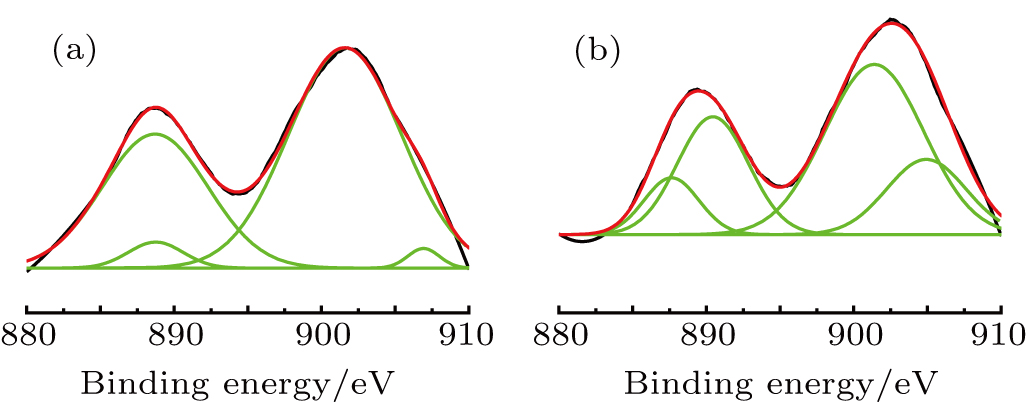 | Fig. 6. XPS spectrum and fitting curves of Ce3+ in the color conversion glass ceramics sintered at 600 °C (a) and 750 °C (b). |
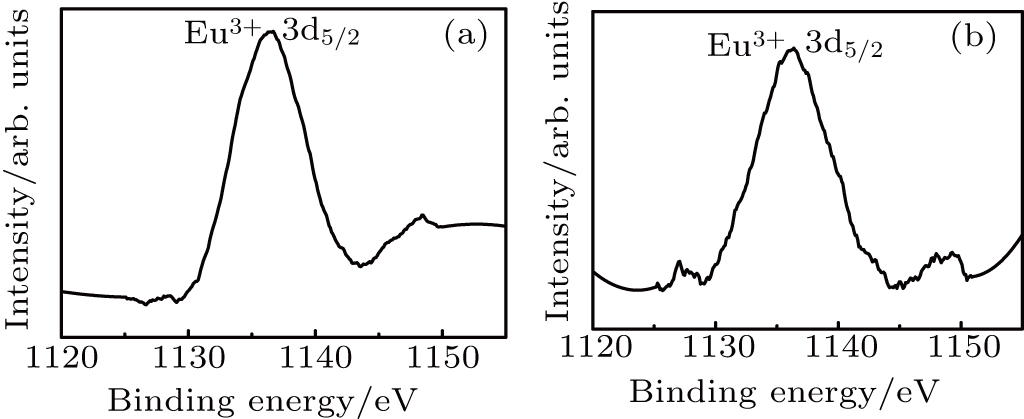 | Fig. 7. XPS spectrum of Eu3+ of the color conversion glass ceramics sintered at 600 °C (a) and 750 °C (b). |
| Table 1.
Relative percentage of Ce3+ in the glass ceramics sintered at 600 °C and 750 °C. . |
Through a series of tests, the luminescence properties of (SrBaSm)Si2O2N2: (Eu3+Ce3+) blue–green color conversion glass ceramics changed with sintering temperature is experimentally studied and verified. When the sintering temperature raises from 600 °C to 700 °C, the luminous intensity of the color conversion glass ceramics is gradually weakened, but still possess luminescent properties. However, when the sintering temperature exceeds 750 °C, the luminescence intensity of the glass ceramics decreases linearly and approaches to zero. Meanwhile, the color conversion glass ceramics have almost no fluorescence characteristics. The blue–green phosphors were thermally quenched at 750 °C. Moreover, the lattice structure of the phosphors was destroyed by the glass matrix and the Ce3+ in the phosphors was oxidized to Ce4+, which further caused a decrease in luminescent intensity of color conversion glass ceramics. In general, the experimental results show that low sintering temperature has a positive effect on the luminescence properties of blue–green color conversion glass ceramics.
| [1] | |
| [2] | |
| [3] | |
| [4] | |
| [5] | |
| [6] | |
| [7] | |
| [8] | |
| [9] | |
| [10] | |
| [11] | |
| [12] | |
| [13] | |
| [14] | |
| [15] | |
| [16] | |
| [17] | |
| [18] | |
| [19] | |
| [20] | |
| [21] | |
| [22] | |
| [23] | |
| [24] | |
| [25] | |
| [26] | |
| [27] | |
| [28] | |
| [29] | |
| [30] | |
| [31] | |
| [32] | |
| [33] | |
| [34] | |
| [35] | |
| [36] | |
| [37] | |
| [38] | |
| [39] | |
| [40] | |
| [41] | |
| [42] | |
| [43] | |
| [44] | |
| [45] | |
| [46] |


