Highly reliable and selective ethanol sensor based on α-Fe2O3 nanorhombs working in realistic environments
Yan Wenjun1, †, Zeng Xiaomin2, †, Liu Huan1, Guo Chunwei1, Ling Min2, Zhou Houpan1, §
Smart City Research Center, School of Automation, Hangzhou Dianzi University, Hangzhou 310018, China
Provincial Key Laboratory of Advanced Chemical Engineering Manufacture Technology, College of Chemical and Biological Engineering, Zhejiang University, Hangzhou 310027, China


† Corresponding author. E-mail: yanwenjun@hdu.edu.cn houpan@hdu.edu.cn

Abstract
Abstract

A highly reliable and selective ethanol gas sensor working in realistic environments based on alpha-Fe2O3 (α-Fe2O3) nanorhombs is developed. The sensor is fabricated by integrating α-Fe2O3 nanorhombs onto a low power microheater based on micro-electro-mechanical systems (MEMS) technology. The α-Fe2O3 nanorhombs, prepared via a solvothermal method, is characterized by transmission electron microscopy (TEM), Raman spectroscopy, x-ray diffraction (XRD), and x-ray photoelectron spectroscopy (XPS). The sensing performances of the α-Fe2O3 sensor to various toxic gases are investigated. The optimum sensing temperature is found to be about 280 °C. The sensor shows excellent selectivity to ethanol. For various ethanol concentrations (1 ppm–20 ppm), the response and recovery times are around 3 s and 15 s at the working temperature of 280 °C, respectively. Specifically, the α-Fe2O3 sensor exhibits a response shift less than 6% to ethanol at 280 °C when the relative humidity (RH) increases from 30% to 70%. The good tolerance to humidity variation makes the sensor suitable for reliable applications in Internet of Things (IoT) in realistic environments. In addition, the sensor shows great long-term repeatability and stability towards ethanol. A possible gas sensing mechanism is proposed.

1. Introduction

Ethanol sensors have been extensively applied in numerous fields, such as chemical industries, the development of fungi and bacteria in foodstuffs, ethanol breath analyzers in drivers’ breath, and so on. Gas sensors based on metal-oxide-semiconductors have attracted widely attention in the last decades, due to their small size and low cost.[15] However, the miniaturized and low-power gas sensors remain deployment for reliable applications in Internet of Things (IoT) in realistic environments.

Hematite (α-Fe2O3), n-type semiconductor (Eg = 2.1 eV), is the most thermodynamically stable iron oxide under ambient conditions.[6] Because of its environmentally friendly, high resistance to corrosion and low cost, α-Fe2O3 has widespread applications in various fields, such as magnetic devices, catalysts, electronic materials, gas sensors, biological and medical fields.[712] Sensor devices based on α-Fe2O3 nanostructures have been reported, for different gas detections, such as volatile organic compounds (VOCs),[7] ethanol,[8, 13, 14] H2S,[15] and NO2.[16, 17] Noteworthily, α-Fe2O3 could provide rapid response/recovery gas sensing properties due to its special valence state.[13, 18, 19] However, the pristine α-Fe2O3-based gas sensors for reliable applications have not received much attention, especially the ones with immunity to humidity in realistic environments. Furthermore, limited reports on the great selectivity of the pristine α-Fe2O3 to ethanol are available.[20, 21]

Generally, the ambient humidity varies greatly in realistic environments from case to case, and even in different seasons. The vulnerability to humidity not only makes drift of the gas sensor response, but also deteriorates the long-term stability of gas sensors. For the application in realistic environments, a great immunity to humidity of gas sensors is vital. In previous reports,[2224] ambient humidity had no obvious effect on the gas sensing properties when the sensor device worked at high temperatures. This is due to that water adsorption is too small at high temperature.

So as to provide control over the sensing temperature and keep the low-power consumption of a device while heating the sensing material, a microfabricated heater is needed. With the developments of microelectronics and IoT, the device sizes shrink continuously as predicted by Moore’s law.[25, 26] The miniaturized, low cost, and low-power ( ) gas sensor could be developed by integrated with a microheater based on micro-electro-mechanical systems (MEMS) technology. The low cost is obtained from batch fabrication of the microheaters.[27]

Given the challenges of gas sensors for reliable applications in realistic environments and the relative lack of knowledge of the pristine Fe2O3-based gas sensors, an exploration of the gas sensing properties of α-Fe2O3 nanorhombs is in order. Here, we report the characterizations of a highly reliable and selective ethanol sensor with immunity to humidity based on α-Fe2O3 nanorhombs. The α-Fe2O3 nanorhombs are synthesized using solvothermal method. Owing to control the sensing temperature and enhance the sensing response and recovery, α-Fe2O3 is integrated onto a microheater. The sensor devices are tested in different humid environments. The relative humidity (RH) dependence on ethanol sensing is experimentally investigated. A cross-sensitivity to other VOCs and ammonia was also performed. A reasonable gas sensing mechanism is discussed.

2. Materials and methods
2.1. Synthesis of α-Fe2O3 nanorhombs

The α-Fe2O3 nanorhombs were prepared via a solvothermal route.[18] Typically, 0.202 g of Fe(NO3)3 9H2O, 0.300 g of poly(N-viny1-2-pyrrolidone) (PVP, Mw = 30000), and 0.277-g CH3COONa were dissolved in 30-ml methanol aqueous solution with constant stirring at room temperature. The volume ratio of DI water and methanol is 2:1. After stirring for 1 h, the brownish solution was then turned into a Teflon-lined stainless steel autoclave of 50-ml capacity. The sealed tank was put into an oven and heated at 200 °C for 24 h. After reaction, the autoclave was cooled to room temperature naturally. The reddish brown precipitates were collected by centrifugation, washed with DI water and ethanol several times, and dried at 60 °C in air. Finally, the product was put into a muffle oven for calcination in air atmosphere at 450 °C for 4 h with the heating rate of 3 °C/min.

2.2. Characterization

Transmission electron microscopy (TEM) images were taken with a JEOL JEM-2100 microscope to characterize the morphology of α-Fe2O3 nanorhombs. Powder x-ray diffraction (XRD) analyses were performed on a Bruker D8 Advance diffractometer with Cu Kα radiation ( ). X-ray photoelectron spectra (XPS) were performed on an RBD upgraded PHI-5000 C ESCA system (PerkinElmer). XRD and XPS are used for elemental and structural analyses.

2.3. Sensor fabrication

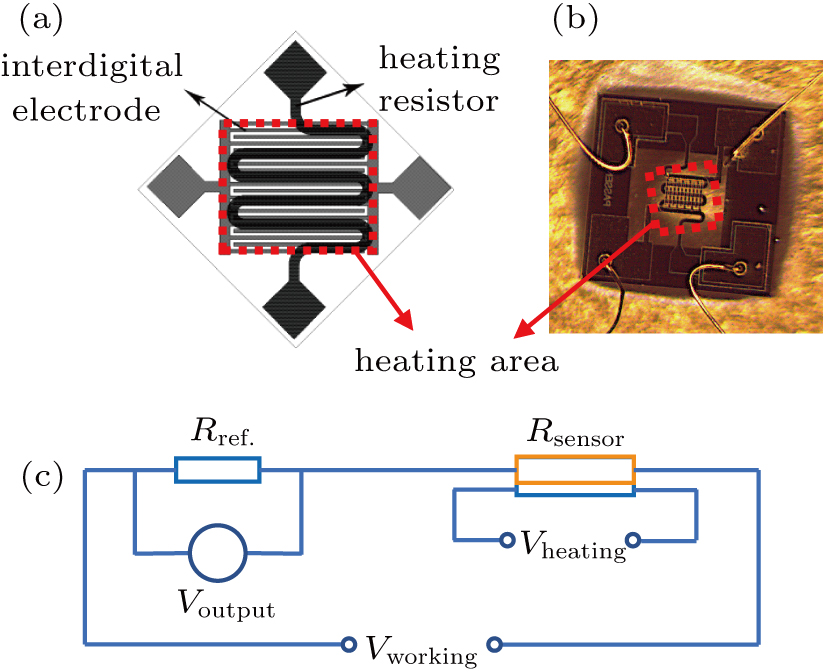
The gas sensor devices were based on an SOI (silicon on insulator) MEMS microheater technology. Figure 1(a) displays the schematic structure of the microheater, and the corresponding optical micrograph is shown in Fig. 1(b). The circuitry, both for heater temperature control and sensing layer resistance readout, was integrated on-chip. A pair of heating electrodes to provide highly uniform working temperature of the sensing material at low power, and interdigitated Au electrodes to form a good Ohmic contact with the sensing material were suspended in a dielectric membrane in the microheater device. The gas sensors were prepared by integrating α-Fe2O3 nanorhombs onto the center of a microheater. The α-Fe2O3 nanorhombs were sonicated into suspension in an aqueous solution of isopropyl alcohol (0.5 mg/mL). A 0.1- drop was placed onto the microheater chip with the heater working at 100 °C and maintained for 2 h to promote solvent evaporation and material deposition at the center of the microheater.

Fig. 1. (a) Schematic structure and (b) optical micrograph of the microheater, (c) the working principle of the gas sensing measurement.
2.4. Sensor testing

The gas sensing properties were evaluated in a homemade measuring system via a static process. For the test, a reference resistor (Rref.) was put in series to form a measurement circuit. The circuit diagram is illustrated in Fig. 1(c). The response of the sensor in air or in a target gas could be measured, by monitoring the voltage across the reference resistor. Response is defined by the percentile resistance change when the sensor is exposed to an analyte gas as follows:

where R0 and Rg are the resistances of the sensor before and after exposed to the analyte gas, respectively.

3. Results and discussion
3.1. Characterization methods

Morphology of the as-synthesized α-Fe2O3 is characterized using TEM. Figure 2(a) and 2(b) show representative low magnification TEM images of the α-Fe2O3 nanorhombs. The nanoparticle size ranges from 45 nm to 65 nm. The measured spacing between the fringes in the lattice is approximately 0.27 nm (Fig. 2(c)), which matches well the (104) d-spacing for the α-Fe2O3. The distinct lattice fringes indicate the high crystallinity of the grains.
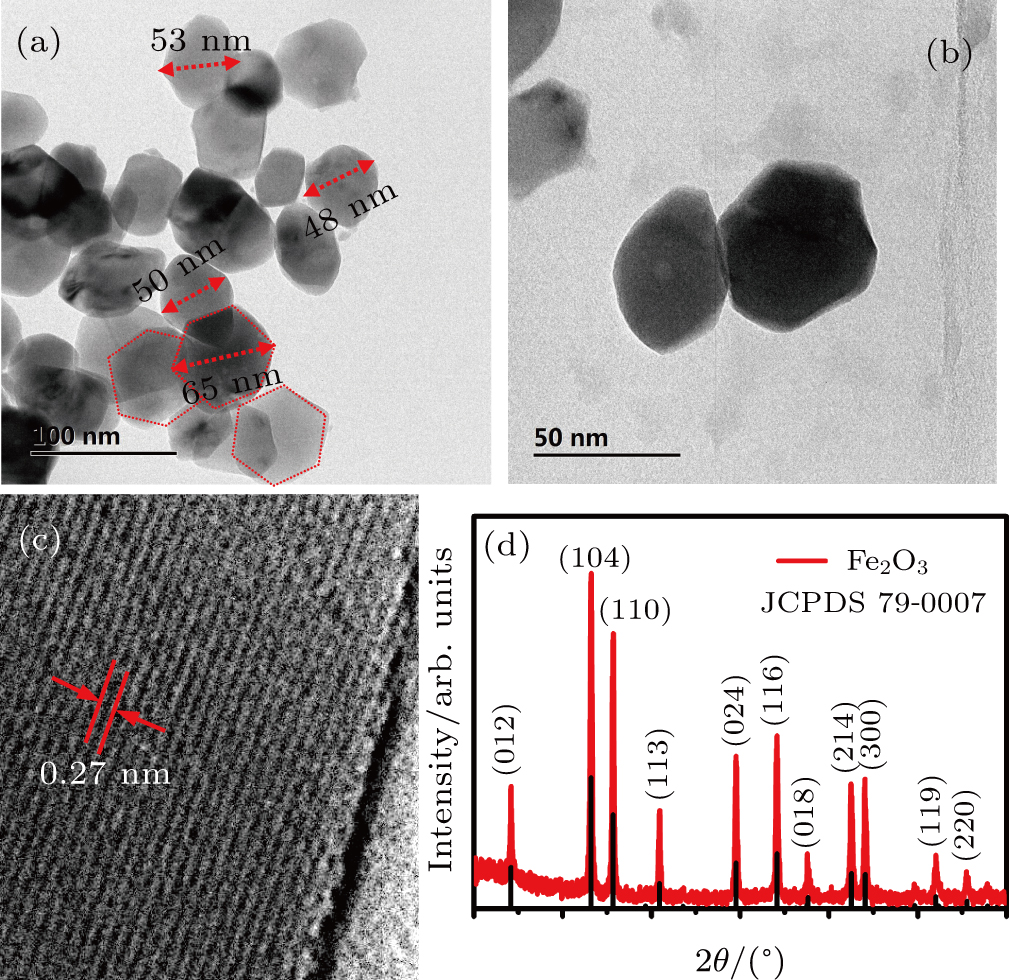
Fig. 2. The α-Fe2O3 nanorhombs: (a) and (b) low magnification TEM images, (c) high resolution micrograph, (d) x-ray diffraction spectrum.

The x-ray diffraction pattern (Fig. 2(d)) shows characteristic peaks for α-Fe2O3 at , 33.2°, 35.7°, 40.9°, 49.5°, 54.1°, 62.5°, and 64.1°, which respectively correspond to the (012), (104), (110), (113), (024), (116), (214), and (300) planes of the hexagonal α-Fe2O3 (JCPDS 79–0007). This XRD results agree with the previous reports.[28, 29] No other phases are observed, indicating the purity and single phase of the prepared α-Fe2O3 nanorhombs. The strongest peak at is corresponding to the α-Fe2O3 (104), which is consistent with its TEM result (Fig. 2(c)).

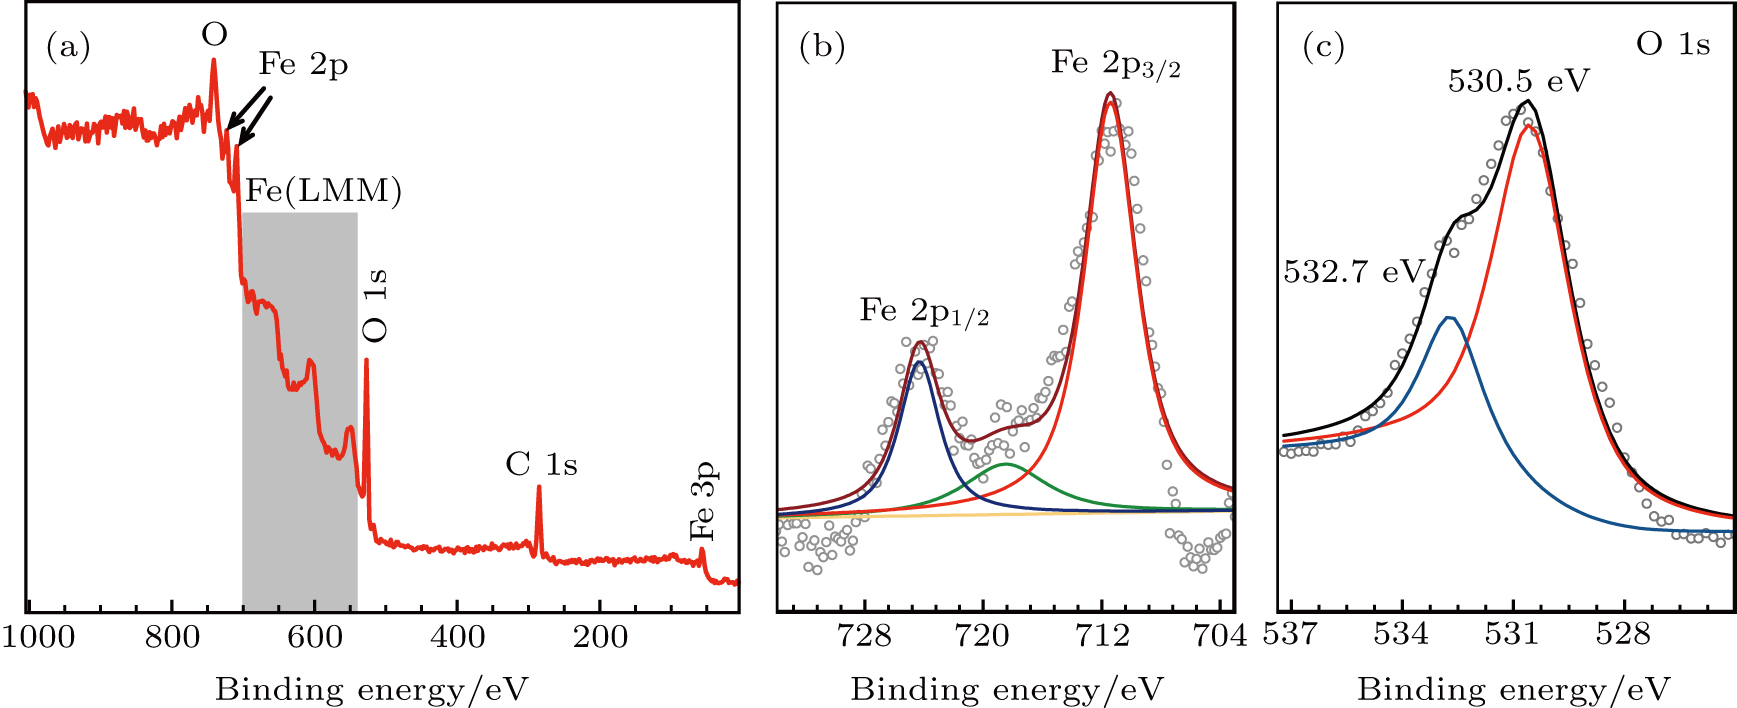
The XPS survey spectrum of the α-Fe2O3 nanorhombs is shown in Fig. 3(a). It reveals the presence of Fe, O, and C elements. According to the Fe 2p high-resolution XPS spectrum in Fig. 3(b), the binding energy peaks at 711.4 eV and 724.3 eV with the corresponding satellite peak at 718.6 eV, are attributed to Fe 2p3/2, 2p1/2, respectively.[15] The energy positions of these peaks indicate a Fe valence state of +3. Two obvious peaks were observed in the O 1s high resolution XPS spectrum as shown in Fig. 3(c), which have the binding energy values of 530.5 eV and 532.7 eV. The peak at 530.5 eV is associated with the lattice oxygen atoms in α-Fe2O3 and the peak at 532.7 eV is linked with the chemisorbed oxygen species on the surface of α-Fe2O3.[30] The large peak area of chemisorbed oxygen species means many chemisorbed oxygen species on the surfaces of α-Fe2O3 nanorhombs.[15]

Fig. 3. (a) X-ray photoelectron spectroscopy (XPS) survey spectrum, (b) Fe 2p and (c) O 1s high-resolution spectra of the α-Fe2O3 nanorhombs.
3.2. Gas sensing performances

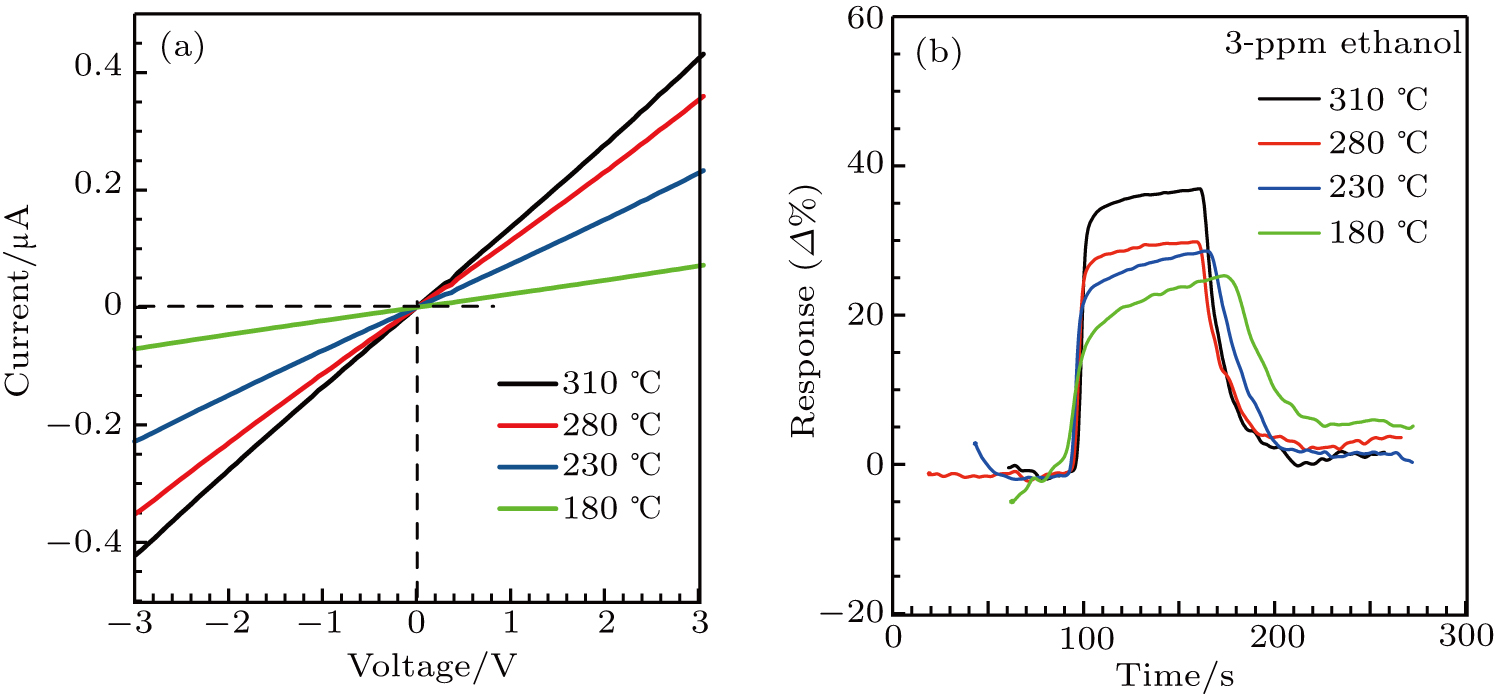
The gas sensing performances of the α-Fe2O3 sensor are related to the working temperature closely. This is because that the adsorption/desorption rates of oxygen molecules and target gas molecules on the sensing material surface are affected by temperature. The gas sensing properties of the α-Fe2O3 sensor are investigated at different operating temperatures of the heater. Nearly linear current versus voltage behaviors at different temperatures suggest an Ohmic contact between α-Fe2O3 and sensor electrodes (Fig. 4(a)). The decreasing resistance with increasing the working temperature is consistent with a typical behavior of semiconductor. At a low temperature ( ), the α-Fe2O3 sensor cannot show an obvious resistance change to ethanol, because the ethanol molecules do not have enough thermal energy to react with the adsorbed oxygen.[20] The response values of the α-Fe2O3 sensor to 3-ppm ethanol at various working temperatures from 180 °C to 310 °C are shown in Fig. 4(b). The response of the sensor to 3 ppm ethanol increases as the temperature increases, while the response and recovery time decreases. This is due to the high temperature accelerating the adsorption and desorption of ethanol molecules on the α-Fe2O3 surface. However, both the response and recovery time are slight at 280 °C and 310 °C, 3 s and 15 s respectively. Considering the response and recovery properties to ethanol and the power consumption of the device, a temperature of 280 °C is taken as the optimum operating temperature, with the power of microheater at 60 mW. Further sensing tests are taken at 280 °C with the ambient humidity of 30%.

Fig. 4. (a) IV curves of the α-Fe2O3 nanorhombs-based sensor at different working temperatures. (b) Response values of the sensor to 3-ppm ethanol at different working temperatures.

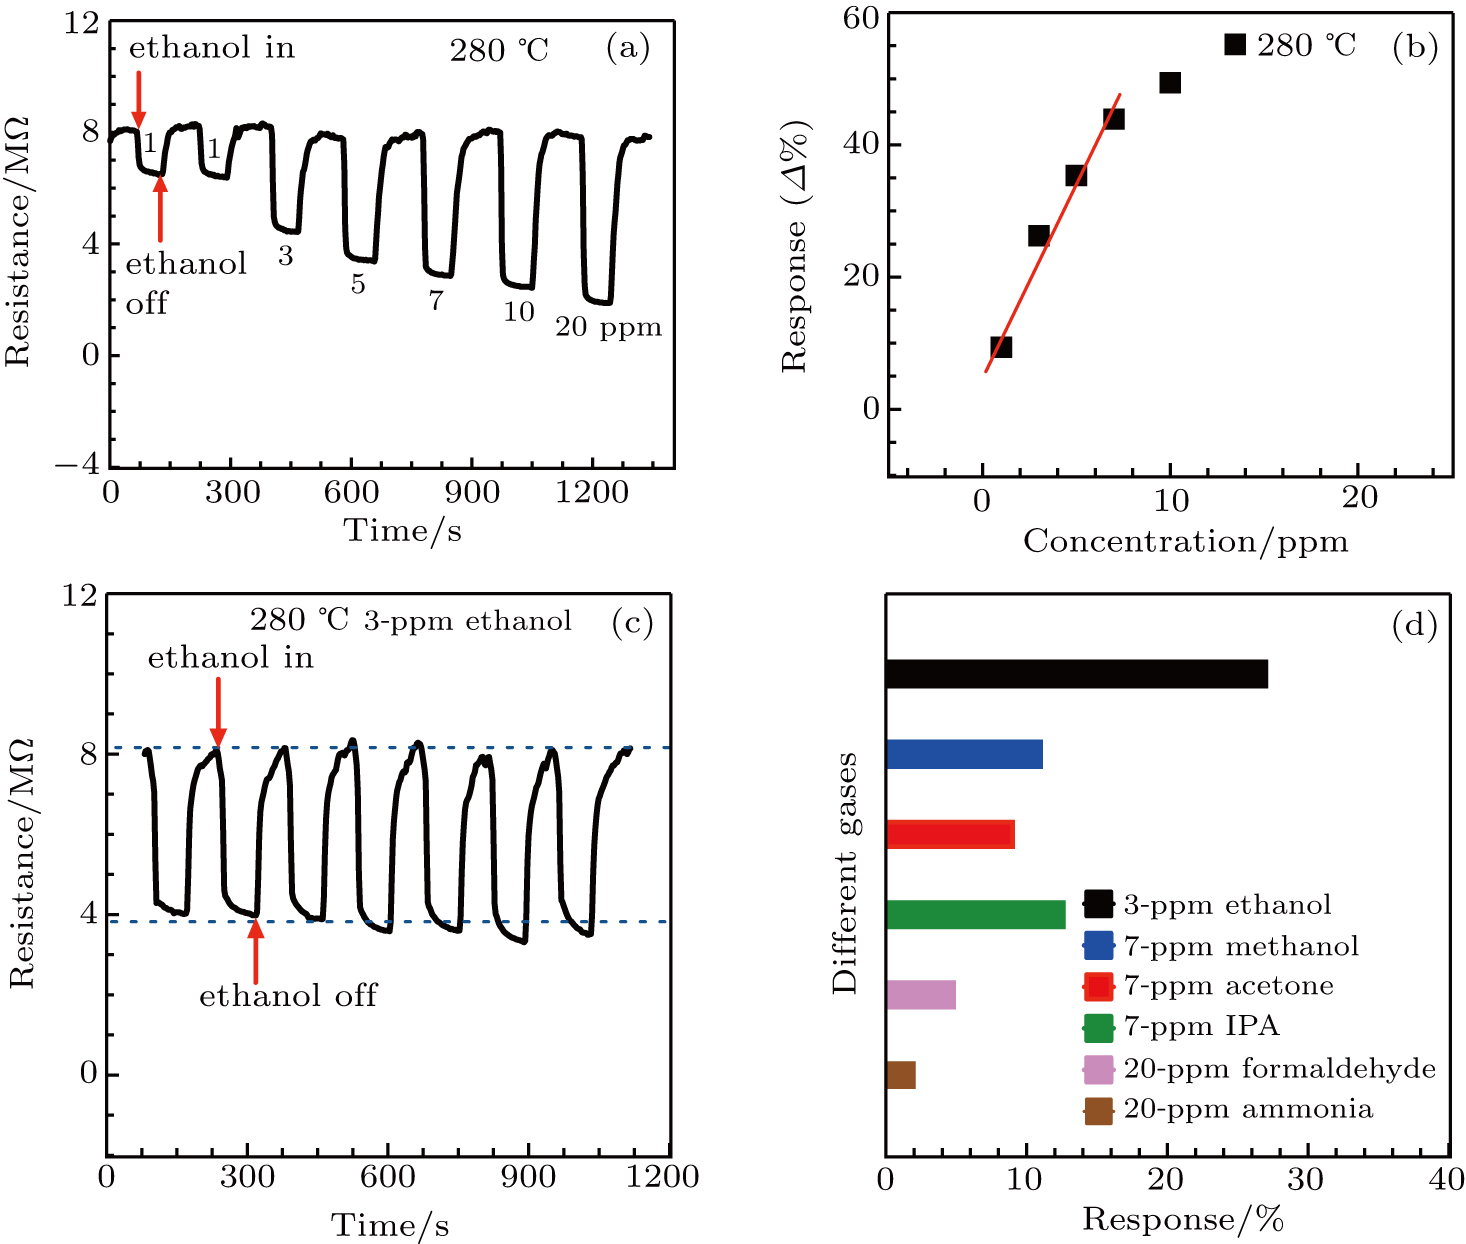
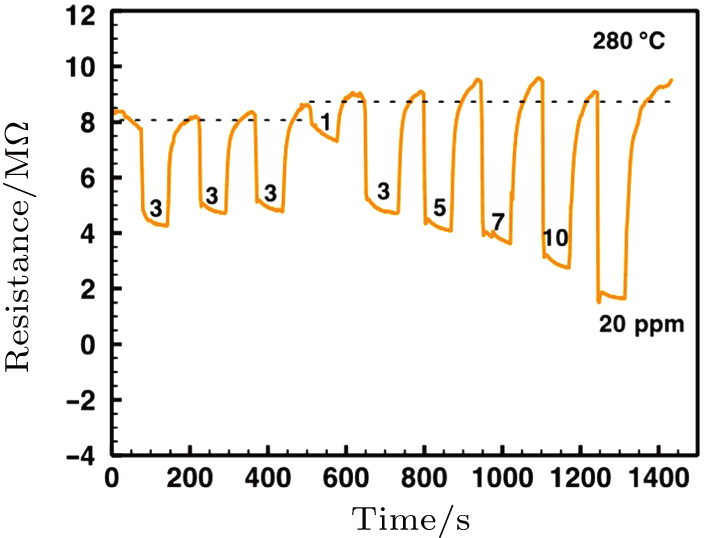
The α-Fe2O3 sensor response to varied concentrations of ethanol from 1 ppm to 20 ppm at 280 °C is shown in Fig. 5(a). The resistance of the sensor decreases upon exposure to ethanol gas, consistent with n-type behavior.[31] For all different concentrations of ethanol, this gas sensor can be fully recovered (e.g., returning back to the baseline) after ethanol gas is quickly replaced by air, indicating the excellent reversibility of the α-Fe2O3 nanorhombs-based sensor. The response increases monotonically with the ethanol gas concentration increasing in the low concentration level of 1 ppm–7 ppm, while tending to saturate above 20 ppm (Fig. 5(b) and Fig. A1 in Appendix A). The response time (tresponse) is defined as the time taken to reach 90% of the full response after the introduction of the target gas. The recovery time (trecovery) is defined as the time taken to return to 90% of the baseline resistance after the flow of target gas is stopped. The sensor has ultra-fast response and recovery times for all ethanol concentrations around 3 s and 15 s, respectively.
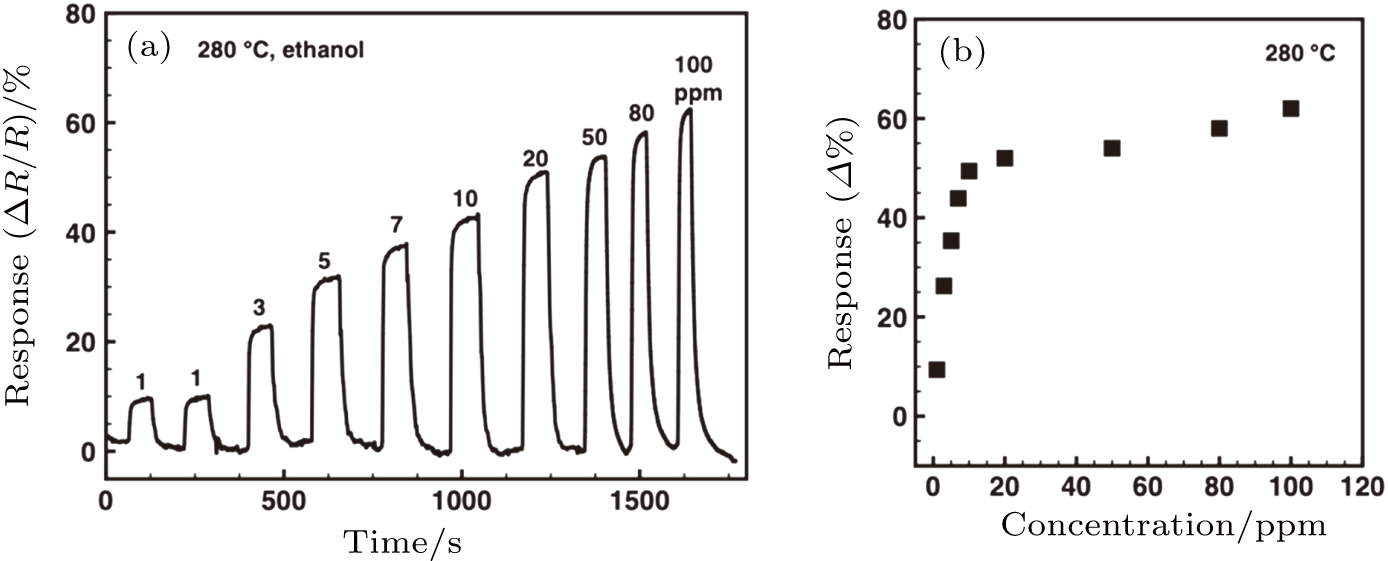
Fig. 5. The α-Fe2O3 nanorhombs-based sensor working at 280 °C: (a) Resistance versus time for various ethanol concentrations (1 ppm–20 ppm), (b) the corresponding response values, (c) repeatability for 3 ppm ethanol, (d) selectivity for various gases.
Fig. A1. The α-Fe2O3 nanorhombs-based sensor working at 280 °C: (a) Resistance versus time for various ethanol concentrations (1 ppm–100 ppm), (b) the corresponding response values.

Repeated response/recovery measurement of the α-Fe2O3 sensor to 3-ppm ethanol gas for 7 cycles are shown in Fig. 5(c), which indicates well repeatable behavior. Additionally, the selectivity of the α-Fe2O3 sensor is displayed in Fig. 5(d) among the gases of methanol, acetone, isopropyl alcohol (IPA), formaldehyde, and ammonia gas at higher concentrations, while the measurement of ethanol gas is at a lower concentration of 3 ppm. The results confirm the great selectivity of the α-Fe2O3 sensor to ethanol molecules.

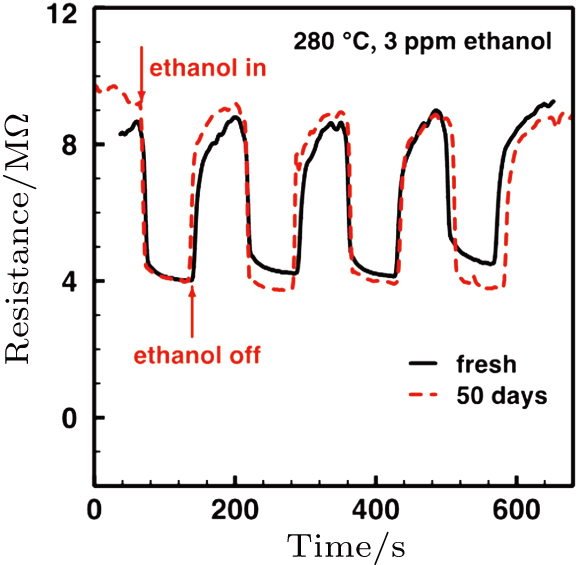
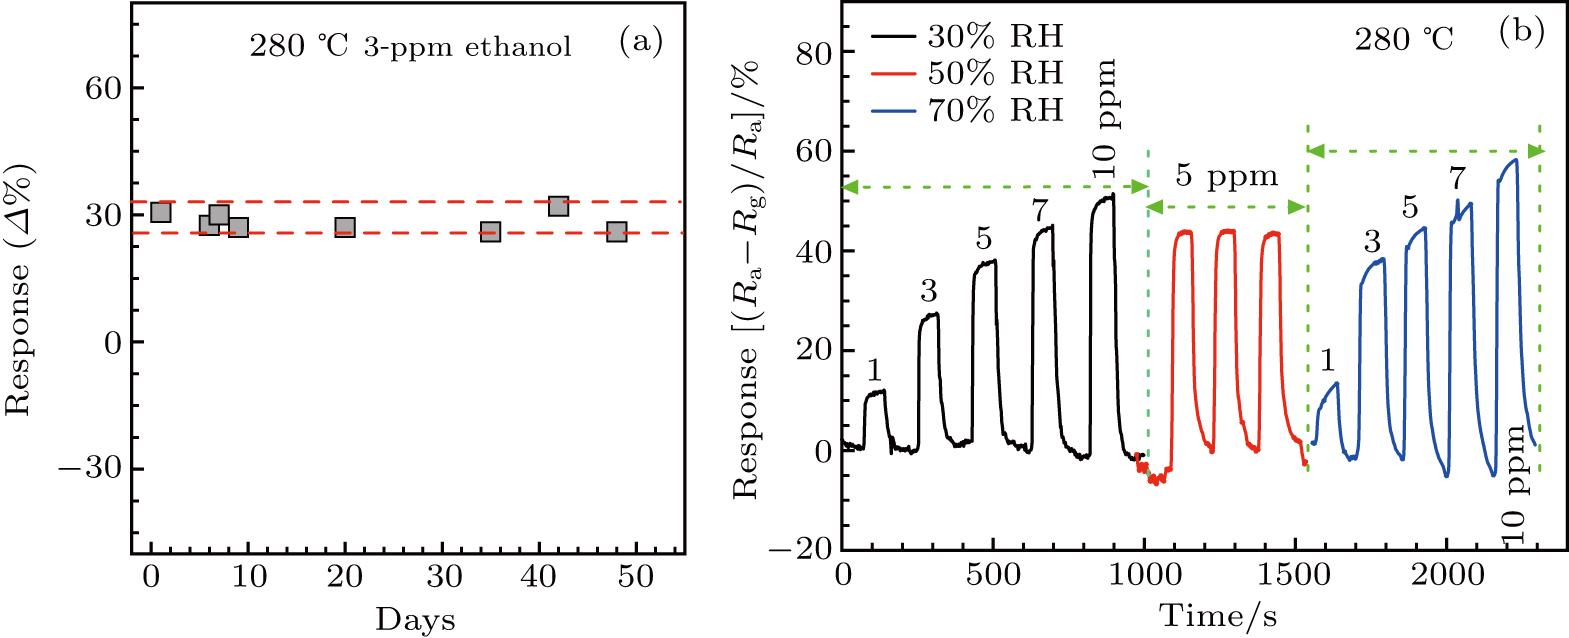
Excellent long-term stability of gas sensors is another essential requirement for reliable applications. The responses of the α-Fe2O3 sensor to 3-ppm ethanol gas were measured over a period of 50 days, while the sensor is always on at the working temperature of 280 °C. The response values and the reproducible resistance time are shown in Fig. 6(a) and Fig. A2 in Appendix A. An insignificant response average variation of around 4% was observed (Fig. 6(a)). Hence, the α-Fe2O3 nanorhombs-based sensor exhibits a great long-term stability.

Fig. 6. The α-Fe2O3 nanorhombs-based sensor working at 280 °C: (a) long-term stability to 3-ppm ethanol, and (b) response to various ethanol concentrations (1 ppm–10 ppm) in different humidity conditions.
Fig. A2. Repeatability for 3-ppm ethanol of the fresh α-Fe2O3-based sensor and the one over working at 280 °C for 50 days.

Humidity is a critical issue for all semiconducting solid-state sensor devices due to the varying humidity in realistic environment. As shown in Fig. 6(b), the response and recovery properties of the α-Fe2O3 sensor to ethanol gas at relative humidity (RH) of 30%, 50%, and 70% were tested. Here, RH was adjusted by humidifier and air conditioner, and monitored by a hygrometer. In this case concentrations were varied from 1 ppm to 10 ppm. Passing from 30% to 70% RH, the response average variation is below 6% for all the analyzed ethanol gas concentrations, indicating saturation of the material with respect to humidity at the operating temperature of 280 °C. This means the acceptable immunity to humidity of the α-Fe2O3 sensor at 280 °C. It can be used to effectively detect ethanol gas in realistic environment, and it is not vital to know the exact RH value. However, baseline of the α-Fe2O3 sensor has a slight drift at 70% RH (Fig. A3 in Appendix A). Therefore, ethanol sensing performances of the α-Fe2O3 sensor in high humidity should be improved.

Fig. A3. Resistance versus time for various ethanol concentrations (1 ppm–20 ppm) of the α-Fe2O3-based sensor at 280 °C & 70% RH.
3.3. Gas sensing mechanism

The gas sensing mechanism of α-Fe2O3 sensor has been clarified in many previous reports.[13, 31] The model is based on the change in resistance caused by the adsorption and desorption of gas molecules on the surface of sensing films. In air ambient, the oxygen molecules are adsorbed on the α-Fe2O3 surface. The adsorbed oxygen molecules capture electrons from the conduction band of the α-Fe2O3 surface layer, which results in the formation of chemisorbed oxygen ions O at the operating temperature of 280 °C, according to the following equation:[32]

Hence, an electron depletion layer is formed on the surface of α-Fe2O3, and a potential barrier is generated contributing to a high resistance state.

Upon exposure to ethanol gas, the ethanol molecules react with the adsorbed O ions on α-Fe2O3 surface and release the trapped electrons back to conduction band of α-Fe2O3, resulting in a reduced potential barrier energy. Accordingly, the sensor’s resistance is decreased. These can be expressed according to the following reactions:

According to the previous reports,[33, 34] the nanosize of α-Fe2O3 possesses large surface-to-volume which is favor for its sensing performances enhancement. Additionally, the α-Fe2O3 self could provide efficient and rapid electron exchange between the cations: , contributing to a great resistance change and improved gas sensing performances.[18, 19] Due to the weak OH-binding forces at working temperature of 280 °C, the α-Fe2O3 sensor can be applied to effectively detect ethanol gas in realistic environment with immunity to humidity.[2224]

3.4. Gas sensor network

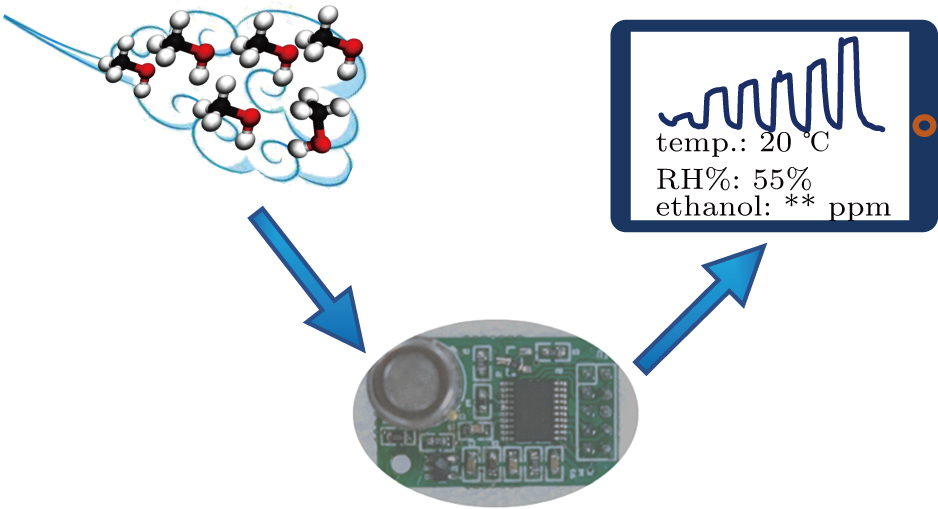
To demonstrate the feasibility of real application of the α-Fe2O3 sensor, the sensor was integrated with a prototype of electronic circuit, which can transmit sensing data to mobile terminal and show the ethanol gas concentration values of the atmosphere. Figure 7 displays the working principle of a gas sensor network. Gas leakage or breath alcohol can be monitored or tested easily.

Fig. 7. Gas sensor network connected by a mobile terminal. The integrated circuit is the picture of real products.
4. Conclusions

Highly reliable and selective ethanol sensors based on α -Fe2O3 nanorhombs integrated with MEMS microheater were successfully prepared. The α-Fe2O3 nanorhombs were synthesized solvothermally. The MEMS gas sensors are found to be power-efficient and on-chip electronic circuit integration is possible. The sensing performances were investigated in the temperature range 180 °C–310 °C, while the corresponding power of the microheater was in the range 44 mW–70 mW. The optimum operating temperature was found to be at 280 °C, with the heater at 60 mW. The sensor showed great selectivity to ethanol gas. The ethanol response was found to be 9%–56% for the concentration range 1 ppm–20 ppm. The response and recovery times were around 3 s and 15 s for all the concentrations (1 ppm–20 ppm) of ethanol, respectively. In the humid conditions (RH of 30%–70%), the α-Fe2O3 ethanol sensor was reliable with acceptable immunity to humidity. The sensor showed excellent repeatability and stability for a long term (50 days) towards ethanol. The MEMS sensors based on α-Fe2O3 nanorhombs are expected to have numerous applications and develop low cost smart ethanol sensor in realistic environments.

Acknowledgments

The authors acknowledge M Ling for help with the TEM, XRD, and XPS characterizations. The authors acknowledge X B Li for support on microheater. The authors acknowledge the 2011 Zhejiang Regional Collaborative Innovation Center for Smart City.

Appendix A: Supplementary materials

Some figures for better understanding the text are given below.

Reference
[1] Gao X Zhang T 2018 Sens. Actuator B-Chem. 277 604 https://doi.org/10.1016/j.snb.2018.08.129
[2] Walker J M Akbar S A Morris P A 2019 Sens. Actuator B-Chem. 286 624 https://doi.org/10.1016/j.snb.2019.01.049
[3] Zeng P Zhang P Hu M Ma S Y Yan W J 2014 Chin. Phys. B 23 058103 https://doi.org/10.1088/1674-1056/23/5/058103
[4] Yan W J Hu M Liang J R Wang D F Wei Y L Qin Y X 2016 Chin. Phys. B 25 040702 https://doi.org/10.1088/1674-1056/25/4/040702
[5] Wang D F Liang J R Li C Q Yan W J Hu M 2016 Chin. Phys. B 25
[6] Machala L Tucek J Zboril R 2011 Chem. Mater. 23 3255 https://doi.org/10.1021/cm200397g
[7] Zolghadr S Khojier K Kimiagar S 2016 Mater. Sci. Semicond. Process. 54 6 https://doi.org/10.1016/j.mssp.2016.06.016
[8] Mirzaei A Janghorban K Hashemi B Bonavita A Bonyani M Leonardi S G Neri G 2015 Nanomaterials 5 737 https://doi.org/10.3390/nano5020737
[9] Wang L Lee C Y Schmuki P 2013 Electrochim. Acta 91 307 https://doi.org/10.1016/j.electacta.2012.12.101
[10] Nasibi M Golozar M A Rashed G 2013 Mater. Chem. Phys. 139 12 https://doi.org/10.1016/j.matchemphys.2012.12.038
[11] Xu Y Y Rui X F Fu Y Y Zhang H 2005 Chem. Phys. Lett. 410 36 https://doi.org/10.1016/j.cplett.2005.04.090
[12] Xu P A Zeng G M Huang D L Feng C L Hu S Zhao M H Lai C Wei Z Huang C Xie G X Liu Z F 2012 Sci. Total Environ. 424 1 https://doi.org/10.1016/j.scitotenv.2012.02.023
[13] Wang L L Fei T Lou Z Zhang T 2011 ACS Appl. Mater Interfaces. 3 4689 https://doi.org/10.1021/am201112z
[14] Wang Y Cao J L Wang S R Guo X Z Zhang J Xia H J Zhang S M Wu S H 2008 J. Phys. Chem. C 112 17804 https://doi.org/10.1021/jp806430f
[15] Wu Z L Li Z J Li H Sun M X Han S B Cai C Shen W Z Fu Y Q 2019 ACS Appl. Mater. Interfaces 11 12761 https://doi.org/10.1021/acsami.8b22517
[16] Hjiri M Aida M S Neri G 2019 Sensors 19 https://doi.org/10.3390/s19010167
[17] Bandgar D K Navale S T Khuspe G D Pawar S A Mulik R N Patil V B 2014 Mater. Sci. Semicond. Process. 17 67 https://doi.org/10.1016/j.mssp.2013.08.016
[18] Yang T Y Wang D X Zhai C B Luo Y Zhang M Z 2018 Mater. Lett. 210 1 https://doi.org/10.1016/j.matlet.2017.08.120
[19] Lou Z Li F Deng J A Wang L L Zhang T 2013 ACS Appl. Mater. Interfaces 5 12310 https://doi.org/10.1021/am402532v
[20] Li Z Huang Y Zhang S Chen W Zhong K Ao D Wei L Fu Y 2015 J. Hazard. Mater. 300 167 https://doi.org/10.1016/j.jhazmat.2015.07.003
[21] Li Z Lin Z Wang N Huang Y Wang J Wei L Fu Y Wang Z 2016 Mater. & Des. 110 532 https://doi.org/10.1016/j.matdes.2016.08.035
[22] Yan W J Worsley M A Pham T Zettl A Carraro C Maboudian R 2018 Appl. Surf. Sci. 450 372 https://doi.org/10.1016/j.apsusc.2018.04.185
[23] Donarelli M Prezioso S Perrozzi F Giancaterini L Cantalini C Treossi E Palermo V Santucci S Ottaviano L 2015 2D Mater. 2 9
[24] Hoefer U Frank J Fleischer M 2001 Sens. Actuator B-Chem. 78 6 https://doi.org/10.1016/S0925-4005(01)00784-5
[25] Moore G E 1998 Proc. IEEE 86 82 https://doi.org/10.1109/JPROC.1998.658762
[26] Amendola S Lodato R Manzari S Occhiuzzi C Marrocco G 2014 Ieee Int. Things 1 144 https://doi.org/10.1109/JIOT.2014.2313981
[27] Liu H T Zhang L Li K H H Tan O K 2018 Micromachines 9
[28] Cao H Wang G Zhang L Liang Y Zhang S Zhang X 2006 ChemPhysChem 7 1897 https://doi.org/10.1002/cphc.200600130
[29] Chen S Bao P Wang G 2013 Nano Energy 2 425 https://doi.org/10.1016/j.nanoen.2012.11.012
[30] Ma Y Yang J Yuan Y K Zhao H Shi Q Zhang F J Pei C J Liu B Yang H Q 2017 Langmuir 33 8671 https://doi.org/10.1021/acs.langmuir.7b00455
[31] Sun P Wang W Liu Y Sun Y Ma J Lu G 2012 Sens. & Actuators B Chem. 173 52 https://doi.org/10.1016/j.snb.2012.05.057
[32] Li Z Li H Wu Z Wang M Fu Y Q 2019 Mater. Horizons 6 23
[33] Rothschild A Komem Y 2004 J. Appl. Phys. 95 6374 https://doi.org/10.1063/1.1728314
[34] Garzella C Comini E Tempesti E Frigeri C Sberveglieri G 2000 Sens. Actuators B: Chem. 68 189 https://doi.org/10.1016/S0925-4005(00)00428-7