Fluctuation of arc plasma in arc plasma torch with multiple cathodes
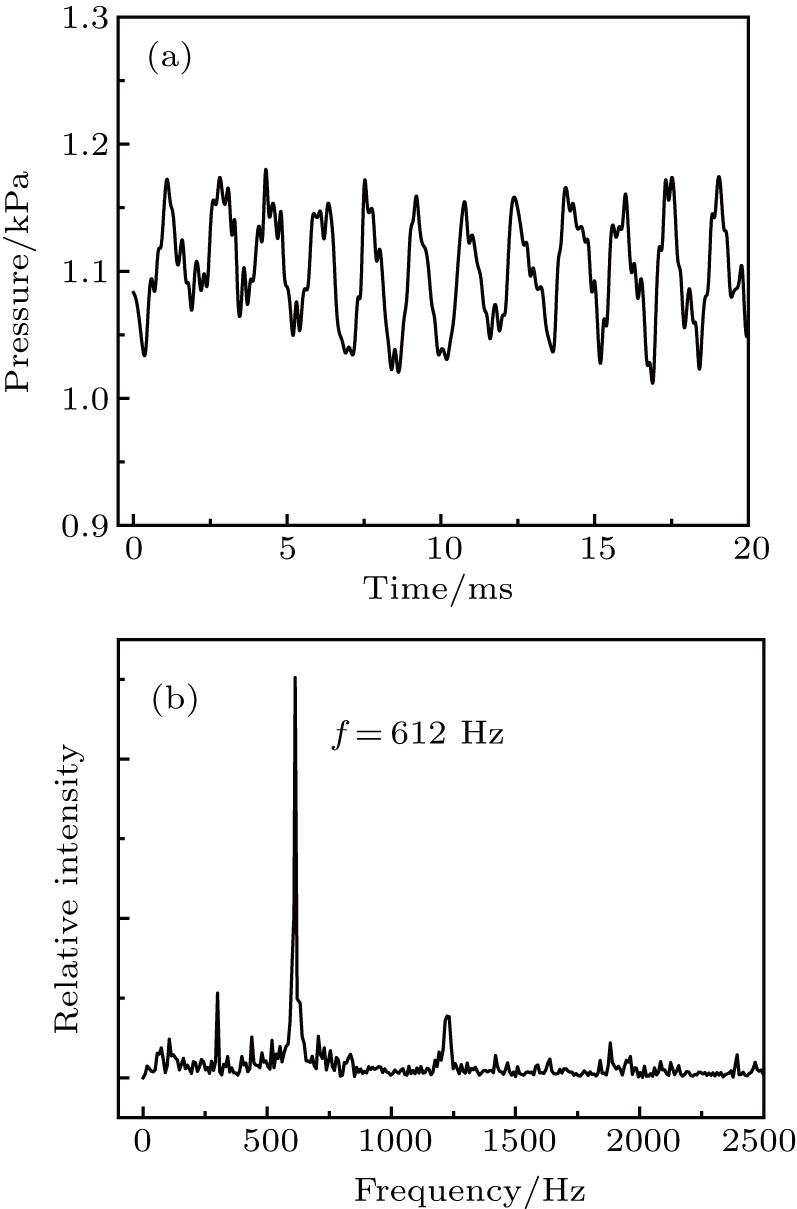
(a) Pressure variation over time. (b) FFT spectra of the pressure shown in Fig.

Fluctuation of arc plasma in arc plasma torch with multiple cathodes |
|
(a) Pressure variation over time. (b) FFT spectra of the pressure shown in Fig. |
 |