Forward-headed structure change of acetic acid–water binary system by stimulated Raman scattering
Liu Zhe1, Yang Bo1, 2, Zhao Hong-Liang3, Li Zhan-Long1, Men Zhi-Wei1, Wang Xiao-Feng1, Wang Ning1, Cao Xian-Wen1, Wang Sheng-Han1, 2, †, Sun Cheng-Lin1, 2, ‡
Key Laboratory of Physics and Technology for Advanced Batteries (Ministry of Education), College of Physics, Jilin University, Changchun 130012, China
State Key Laboratory of Superhard Materials, College of Physics, Jilin University, Changchun 130012, China
College of Aviation Foundation, Aviation University of Air Force, Changchun 130000, China


† Corresponding author. E-mail: shenghan@jlu.edu.cn chenglin@jlu.edu.cn

Abstract
Abstract

The acetic acid–water binary system is a classical hydroxy–carboxy mixed system, while new and interesting phenomena appear under stimulated Raman scattering (SRS). Compared with the weaker signal of the acetic acid–water binary system obtained in spontaneous Raman scattering, SRS provides a finer band and a relatively distinct structural transition point. The structural transformation points are respectively at 30% and 80% by volume ratio under the condition of spontaneous Raman spectroscopy, while they are respectively at 15% and 25% under the condition of SRS. This phenomenon is attributed to the generation of laser induced plasma and shockwave induced dynamic high pressure environment during SRS.

1. Introduction

Acetic acid, the main component of vinegar as well as one of the most important organic acids, is widely used in pesticides, medicine, organic chemical industry, food additives, and other fields.[15] Investigation about the structural feature of vinegar–water mixed solution has always been the focal point in the purification of vinegar.[68] Based on previous researches, the main factor affecting the separation efficiency of vinegar out of water is the various hydrogen bond (H bond) structures in the acetic acid–water solution.[9,10] Generally speaking, H bonding is a kind of special intermolecular interaction, existing in systems with a large number of H molecules (generally liquid phase), and plays an important role in many physical properties of liquid substances.[1113] In the acetic acid–water solution, the acetic acid molecule is both the donor and the acceptor of H bond simultaneously. Two or more H bonds combination modes of acetic acid molecules and water molecules result in different molecular association structures.[14,15] The molecular association of acetic acid affects various physical and chemical properties of the acetic acid–water solution directly. Accordingly, this topic has always been a research hot spot worldwide. Jakobsen et al. considered that the main structure of liquid acetic acid is a cyclic dimer composed of two O–H H bonds.[16] Wu et al. revealed the presence of linear chains involving H–C and O–H H bonding in the liquid acetic acid.[17] Briggs et al. found that pure liquid acetic acid involves strong H bond. Molecular chains are more easily formed in the liquid acetic acid and the proportion of cyclic dimer structure is relative small.[18] It is concluded that the spontaneous Raman spectroscopy method can play an significant role in the study of the acetic acid molecular structure. It is possible to grasp the changes of H bonds and molecular structures by analyzing the measured Raman feature.

Spontaneous Raman spectroscopy shows relatively broad and weak peaks, bringing about difficulties to the correlated researches. Stimulated Raman scattering (SRS) spectroscopy, as a supplement of spontaneous Raman spectroscopy, has gradually entered the material analysis field.[19] SRS is usually excited by high-energy pulsed laser which can be used to study the molecular structure under the extreme conditions of instantaneous high temperature and high pressure. The Raman peaks in SRS are sharper, so the cluster structure of liquid molecules can be studied more accurately. After the intense pulsed laser beam is focused in the material, the energy density at the focal point increases instantaneously. When the energy density is larger than the threshold of the material, plasma generates.[20] Finally, the internal environment of the material changes dramatically. With the propagation of the laser induced plasma, a large number of excess electrons generate as well. The electrostatic effect of MW order of magnitude can be formed in the local area of the material.[21] Therefore, SRS spectroscopy is often applied in the study of H bonding structures in aqueous solutions due to the enhanced Raman signals. Recent years, the SRS method goes through a rapid development in the field of H bonding network in liquid water thanks to continuous efforts of researchers. Yuan et al. excited two abnormal radiations at 460 nm and 480 nm respectively by 532 nm nanosecond laser, which were caused by the anti-Stokes phenomenon of SRS at the water–air or water–plasma interface.[22] Kumar et al. discovered the energy-dependent evolution of Stokes and anti-Stokes lines of ice VII in liquid water using a strong pulsed laser with a wavelength of 532 nm and a width of 30 ps.[23] Hafizi et al. demonstrated that the Stokes wave could re-focus the pump wave after the power falls below the critical power through an analytical model and propagation stimulation.[24] Our group also investigated the strong and weak H bonds in liquid water and heavy water with the pre-resonance enhancement SRS under dynamic high pressure.[25,26] SRS method plays an important role in the study of H bond structure in liquid water, however, little has been used in the study of acetic acid and acetic acid–water solution.

Herein, both the spontaneous Raman spectra and the SRS spectra of acetic acid and its aqueous solution under different blending ratios were discussed in depth. Different results were found between the two kinds of Raman spectra. A two-peaks distribution of acetic acid and water occurred at a volume ratio of 15% in the SRS spectra, which was different from the corresponding spontaneous Raman results. We analyzed the spectral characteristics of different volume ratios of acetic acid–water solution from the view of the corresponding H bond and acetic acid–water cluster structure. This research will be helpful to improve the separation efficiency of vinegar–water on the basis of molecular vibration.

2. Experiments

Ultra pure liquid water and analytically pure acetic acid were employed to prepare the acetic acid–water binary system, which both were purchased from Sigma-Aldrich Company. The spontaneous Raman spectra of the acetic acid–water binary system were measured and recorded by an InVia Raman confocal microscopic spontaneous Raman spectrometer manufactured by Renishaw. The 514.5 nm laser source with an output power of 2.2 mW was focused on the sample with a 20 × magnification objective lens. The integration time is 60 s and the resolution is 1 cm−1.

In the SRS experiment, a frequency-tripled Nd:YAG laser emited a laser pulse with 8 ns width at a wavelength of 355 nm in base mode. The pulsed laser beam was focused by a focal lens (f = 20 cm) into the acetic acid–water solution in a quartz cell of 100 mm × 10 mm × 45 mm. The forward SRS signal was received by a Maya 2000 spectrometer. All the experiments were carried out continuously under normal temperature and pressure.

3. Results and discussion

First, the spontaneous Raman spectra of the acetic acid–water solution with different volume ratios were measured. The volume ratio of acetic acid varied from 10% to 100% in steps of 10%. As shown in Fig. 1, when the volume ratio changes, the Raman peaks from 3000 cm−1 to 3800 cm−1 which belong to the OH vibration show an evident frequency shift. As shown in Fig. 2(a), the peaks at 3242 cm−1 and 3443 cm−1 are due to the symmetric and asymmetric stretching vibrations of water, respectively.[27] From Fig. 2(b), the Raman peaks have almost no frequency shift when the volume ratio is less than 30%; the Raman peaks at both 3242 cm−1 and 3443 cm−1 move to high wavenumber rapidly when the volume ratio is higher than 30%; the Raman peak at 3242 cm−1 disappears when the volume ratio is 50%; the Raman peak at 3443 cm−1 shows no frequency shift when the volume ratio is higher than 80% and disappears completely when the volume ratio is 100%. According to the literature,[28] the Raman peak at 3443 cm−1 belongs to the OH asymmetric stretching vibration of water molecule under the H bonding, which can not be detected in acetic acid. Therefore, the peak weakens gradually as the volume ratio of water decreases gradually, and there is no Raman peak at 3443 cm−1 in the spectrum when the volume ratio is 100%. Based on the previous research, the hydrated monomer (Mh) structure could be detected when the volume ratio was less than 30%,[29] as shown in Fig. 3(a). The linear dimer (LD) begins to form when the volume ratio reaches 30%,[30,31] as shown in Fig. 3(b). The Raman peak at 3242 cm−1 disappears when the volume ratio is 50%, and the LD structure reaches its maximum when the volume ratio is 50%. Moreover, the proportion of water is lower than that of acetic acid when the volume ratio exceeds 50%, so the OH symmetric stretching vibration of water is weakened and the Raman peak at 3242 cm−1 disappears when the volume ratio is over 50%. Under the micro-local water environment, the H bonds in the cyclic dimer (CD) structure of acetic acid might be destroyed by the water molecule, then a new cyclic association structure through the water molecules connected with the disconnected CD structure is formed, namely, the water separation dimmer (WSD) structure,[32] as shown in Fig. 3(c). Han et al. also believed that the LD structure would transform into WSD structure when the volume ratio increased to 80%,[33,34] as shown in Fig. 3(c). In summary, the Mh structure is the main aggregation mode of the acetic acid–water binary solution when the volume ratio is less than 30%, and the Raman peaks have almost no frequency shift; the LD structure begins to form in large quantities when the volume ratio is between 30% and 80%, and the Raman peaks move to high wavenumber rapidly; the WSD structure appears in the solution when the volume ratio is more than 80%, and the Raman peak shows no frequency shift.

Fig. 1. Spontaneous Raman spectra of acetic acid–water solution with different volume ratios.
Fig. 2. (a) Raman spectra of OH vibration of acetic acid–water solution from 3000cm−1 to 3800 cm−1 in different blending ratios and (b) the corresponding variation trend of Raman shift of bands at 3242 cm−1 and 3443 cm−1.
Fig. 3. Three kinds of molecular structures in acetic acid–water solution: (a) Mh structure, (b) LD structure, (c) WSD structure.

As shown in Fig. 4(a), peak 1714 cm−1 is considered to be caused by the C=O stretching vibration[35] In Fig. 4(b), the Raman peak at 1714 cm−1 has almost no frequency shift when the volume ratio is less than 80% and exhibits obvious frequency shift to low wavenumber when the volume ratio exceeds 80%. This is due to the structural transformation in the acetic acid–water solution while new H bonds are formed. When the volume ratio increases to 80%, the LD structure transforms into WSD structure, which is consistent with our conclusions above.

Fig. 4. (a) Raman spectra of C=O stretching vibration of acetic acid-water solution from 1600 cm−1 to 1800 cm−1 in different blending ratios and (b) the corresponding variation trend of Raman shift of band at 1714 cm−1.

Apart from spontaneous Raman measurements, SRS features of the acetic acid–water solution were measured in different blending ratios. Compared with the abundant vibration distribution of spontaneous Raman spectra, only two vibration peaks were detected by SRS, namely, the CH3 stretching vibration peak at 2868 cm−1 of acetic acid and the OH vibration peak at 3336 cm−1 of water. This phenomenon is caused by the different excitation mechanisms of SRS and spontaneous Raman scattering. Under the condition of steady state limit, the optical path length in the medium is defined as z, then the intensity of the output Stokes signal can be expressed as It can be seen that the Stokes radiation is only derived from the spontaneous Raman scattering noise, thus the Raman signal is relative weak under spontaneous conditions.[36] Unlike spontaneous Raman scattering, SRS is a non-linear optical effect excited by intense laser incidence.[37] As the original Raman noise is enhanced by a large number of incident photons, the emitted signal shows the characteristics of coherent light. In SRS, the weaker vibration modes would be masked by the stronger vibration modes due to the output signal enhanced exponentially. As a result, only the two vibration modes mentioned above are observed in the spectra. In the SRS spectra of the acetic acid–water solution with different volume ratios, we discover that only the 3336 cm−1 peak of water appears in the spectrum when the volume ratio is less than 15%, which corresponds to the OH stretching vibration peak of liquid water under the influence of H bonding network.[38] Previous studies have shown that water molecules exhibit different H bondings at different states due to the different degree of lattice looseness, leading to different Raman features. The Raman peak of OH vibration of gaseous water molecule can reach about 3700 cm−1 because of its loose H bond structure; the characteristic peak wavenumber of OH vibration of solid water molecule (ice Ih) is about 3200 cm−1 because of its dense H bond structure; the H bond structure of liquid water is located between them and the corresponding peak of OH stretching vibration is about 3400 cm−1.[39] Compared with water molecules at the other two states, the H bond structure of liquid water is much complicated, which needs further investigation. Based on the above-mentioned theory, the bond length of OH bond is shortened due to the H bond stretching under the action of plasma shock wave, and the Raman peak of the OH bond moves to low wavenumber. Consequently, the characteristic peak of the water molecule shifts to 3336 cm−1, as shown in Fig. 5(a). However, only the 2868 cm−1 CH3 stretching vibration peak of acetic acid monopolizes the spectra without 3336 cm−1 peak when the volume ratio is higher than 25%, as shown in Fig. 5(b). Based on the above analysis, the Raman peaks at 3336 cm−1 and 2868 cm−1 correspond to the OH stretching vibration of water molecule and the CH3 stretching vibration of acetic acid molecule in the acetic acid–water mixed system.
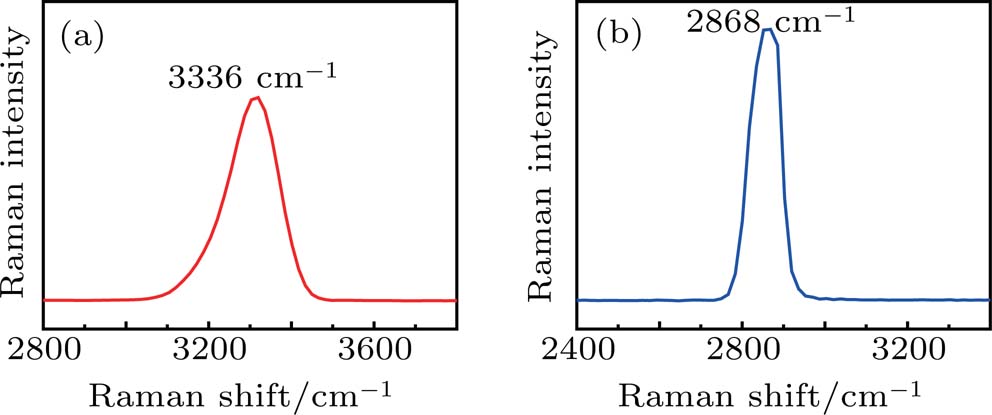
Fig. 5. Spectrum of acetic acid-water solution when the volume ratio is (a) less than 15% and (b) more than 25%.

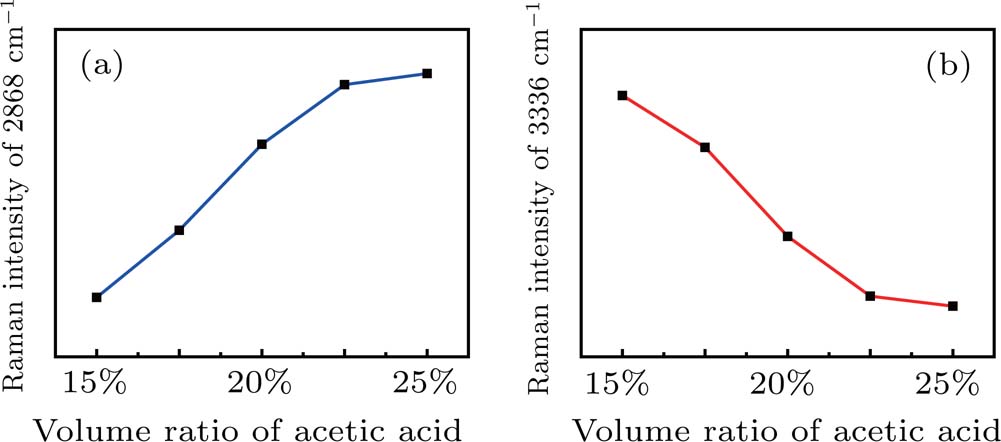
The SRS spectra are shown in Fig. 6 and the corresponding variation trend of the Raman peak intensity with acetic acid volume ratio is shown in Fig. 7. The 2868 cm−1 Raman peak intensity of acetic acid increases while the 3336 cm−1 Raman peak intensity decreases with the increase of the volume ratio as shown in Figs. 7(a) and 7(b). This phenomenon is caused by the increase of the proportion of acetic acid molecule in the cluster structure along with the increase of the volume ratio. When the volume ratio is less than 15%, the proportion of Mh structure begins to increase due to the reduce of the H bond between the acetic acid molecules with the increase of water molecules. In this case, the Mh molecular association structure dominates the acetic acid–water solution. With the volume ratio increasing, a new open LD structure of dihydrate acetic acid molecule generates. Therefore, with the increase of the volume ratio from 15% to 25%, the Mh structure is replaced by the LD structure gradually. In this process, the OH vibration of water molecule is weakened, while the CH3 vibration of acetic acid molecule is strengthened. Therefore, in SRS spectra, the Raman peak at 2868 cm−1 is enhanced, while the Raman peak at 3363 cm−1 is weakened. When the volume ratio is higher than 25%, the WSD structure emerges through new H bonding and acetic acid molecule reaction with the original H bonds being broken by the water molecules. With the volume ratio increasing, water molecules around acetic acid molecules decrease. In consequence, the concentration of WSD molecular structure is relatively high.

Fig. 6. SRS spectra of acetic acid–water solutions with different volume ratios.
Fig. 7. Intensity variation of Raman peaks with volume ratio: (a) 2868 cm−1 and (b) 3336 cm−1.

Except for the change of the Raman peak intensity, the Raman shifts corresponding to the OH stretching vibration peaks at 3316 cm−1, 3330 cm−1, 3336 cm−1, and 3336 cm−1 show a trend of moving towards high wavenumber as the volume ratio increases from 15% to 22.5%. The main reason for this phenomenon is that the proportion of LD structure increases gradually. Compared with the Mh structure, the H bond strength of water in the LD structure is relatively large, which will cause the OH bond to be stretched. Thus, the corresponding peak moves towards the high wavenumber. In conclusion, the peak position moves to high wavenumber as the volume ratio increases from 15% to 22.5% in the SRS experiment.

The structural change points of SRS are 15% and 25%, while those of the spontaneous Raman scattering are 30% and 80%. Distinct differences can be seen from the results. The main reason is that the laser induced plasma and the followed shockwave induced dynamic high pressure will be generated in the SRS process. Under the shockwave induced dynamic high pressure, the cluster structure of water changes in advance. After the intense laser pulse is focused in the liquid water, the laser energy at the focal point is larger than the breakdown threshold of water. A laser induced breakdown (LIB) phenomenon at the focal point of the excitation beam is produced. A plasma cloud which contains a large number of nanobubbles near the ionization region forms by absorbing the laser energy.[40] Since the pressure inside the bubbles is far higher than outside, the plasma nanobubbles burst instantaneously, resulting in a strong shock wave inducing GPa-level dynamic high pressure region. An electric field generates while excess electrons continue to propagate in the dynamic high pressure region. This extreme environment has an impact on the H bonding structure and OH vibration, leading to the structural change points of acetic acid–water solutions moving forward.

4. Conclusion

In summary, the variation of H bond network of the acetic acid–water binary system with different volume ratios is investigated detailedly by spontaneous Raman scattering and SRS methods. Both of spontaneous Raman scattering and SRS spectra demonstrate the existence of two structural transformation points in the acetic acid–water binary system with different volume ratios. However, the SRS results exhibit different features from the spontaneous Raman ones due to the different excitation mechanisms. Great emphases have been put on the laser-induced plasma produced by SRS and the accompanying shockwave induced dynamic high pressure environment. The dynamic effect of this phenomenon on the acetic acid–water binary system is also analyzed. This paper contributes to extend the application of SRS spectroscopy in the area of liquid materials and guide significance for the purification of acetic acid.

Reference
[1] Smith G 2015 Acta Crystallogr. Sect. C-Struct. Chem. 71 140 https://doi.org/10.1107/S205322961500056X
[2] Khedr M A Shehata T M Mohamed M E 2014 Eur. J. Pharm. Sci. 65 130 https://doi.org/10.1016/j.ejps.2014.09.014
[3] Fukami H Tachimoto H Kishi M Kaga T Tanaka Y 2010 J. Agric. Food Chem. 58 4084 https://doi.org/10.1021/jf9045842
[4] de Vlieger D J M Lefferts L Seshan K 2014 Green Chem. 16 864 https://doi.org/10.1039/c3gc41922c
[5] Essel T Y A Koomson A Seniagya M O Cobbold G P Kwofie S K Asimeng B O Arthur P K Awandare G Tiburu E K 2018 Polymer 10 466 https://doi.org/10.3390/polym10050466
[6] Park J M Laio A Iannuzzi M Parrinello M 2006 J. Am. Chem. Soc. 128 11318 https://doi.org/10.1021/ja060454h
[7] Yeom C K Lee K H 1996 J. Membr. Sci. 109 257 https://doi.org/10.1016/0376-7388(95)00196-4
[8] Alghezawi N Şanlı O Aras L Asman G 2005 Chem. Eng. Process. 44 51 https://doi.org/10.1016/j.cep.2004.03.007
[9] Pu L Sun Y M Zhang Z B 2009 J. Phys. Chem. A 113 6841 https://doi.org/10.1021/jp902634h
[10] Pu L Sun Y M Zhang Z B 2010 J. Mol. Liq. 154 124 https://doi.org/10.1016/j.molliq.2010.04.022
[11] Dreyer J 2005 J. Chem. Phys. 122 184306 https://doi.org/10.1063/1.1891727
[12] Heyne K Huse N Dreyer J Nibbering E T J Elsaesser T Mukamel S 2004 J. Chem. Phys. 121 902 https://doi.org/10.1063/1.1762873
[13] D’Amico F Bencivenga F Gessini A Masciovecchio C J 2010 Phys. Chem. B 114 10628 https://doi.org/10.1021/jp103730s
[14] Nishi N Nakabayashi T Kosugi K 1999 J. Phys. Chem. A 103 10851 https://doi.org/10.1021/jp9929061
[15] Heisler I A Mazur K Yamaguchi S Tominaga K Meech S R 2011 Phys. Chem. Chem. Phys. 13 15573 https://doi.org/10.1039/c1cp20990f
[16] Jakobsen R J Mikawa Y Brasch J W 1967 Spectroc Acta. Pt. A-Molec Biomolec. Spectr. 23 2199 https://doi.org/10.1016/0584-8539(67)80107-7
[17] Wu J P 2014 Phys. Chem. Chem. Phys. 16 22458 https://doi.org/10.1039/C4CP03999H
[18] Fang W H Li Z W Sun C L Li Z L Song W Men Z W He L Q 2012 Chin. Phys. B 21 034211 https://doi.org/10.1088/1674-1056/21/3/034211
[19] Zuo Y L Wei X F Zhou K N Zeng X M Su J Q Jiao Z H Xie Na Wu Z H 2016 Chin. Phys. B 25 035203 https://doi.org/10.1088/1674-1056/25/3/035203
[20] Briggs J M Nguyen T B Jorgensen W L 1991 J. Phys. Chem. 95 3315 https://doi.org/10.1021/j100161a065
[21] Wang S H Li Z L Sun C L Li Z W Men Z W 2014 Acta Phys. Sin. 63 205204 (in Chinese) https://doi.org/10.7498/aps.63.205204
[22] Yuan H Gai B D Liu J B Guo J W Li H Hu S Deng L Z Jin Y Q Sang F T 2016 Opt. Lett. 41 3335 https://doi.org/10.1364/OL.41.003335
[23] Kumar V R Kiran P P 2015 Opt. Lett. 40 2802 https://doi.org/10.1364/OL.40.002802
[24] Hafizi B Palastro J P Pe nano J R Gordon D F Jones T G Helle M H Kaganovich D 2015 Opt. Lett. 40 1556 https://doi.org/10.1364/OL.40.001556
[25] Wang S H Fang W H Li F B Gong N Li Z L Li Z W Sun C L Men Z W 2017 Opt. Express 25 31670 https://doi.org/10.1364/OE.25.031670
[26] Li Z L Wang Y D Zhou M Men Z W Sun C L Li Z W 2012 Acta Phys. Sin. 61 064217 (in Chinese) https://doi.org/10.7498/aps.61.064217
[27] Murphy W F Bernstein H J 1972 J. Phys. Chem. 76 1147 https://doi.org/10.1021/j100652a010
[28] Johnson C M Tyrode E Baldelli S Rutl M W Leygraf C 2005 J. Phys. Chem. B 109 321 https://doi.org/10.1021/jp047338q
[29] Génin F Quilès F Burneau A 2001 Phys. Chem. Chem. Phys. 3 932 https://doi.org/10.1039/b008897h
[30] Semmler J Irish D E 1988 J. Solut. Chem. 17 805 https://doi.org/10.1007/BF00646551
[31] Ng J B Shurvell H F 1987 J. Phys. Chem. 91 496 https://doi.org/10.1021/j100286a046
[32] Chocholoušová J Vacek J Hobza P 2003 J. Phys. Chem. A 107 3086 https://doi.org/10.1021/jp027637k
[33] D’Amico F Bencivenga F Gessini A Principi E Cucini R Masciovecchio C 2012 J. Phys. Chem. B 116 13219 https://doi.org/10.1021/jp3088594
[34] Han C Q Liu Y Yang Y Ni X W Lu J Luo X S 2009 Chin. Opt. Lett. 7 357 https://doi.org/10.3788/COL20090704.0357
[35] Lütgens M Friedriszik F Lochbrunner S 2014 Phys. Chem. Chem. Phys. 16 18010 https://doi.org/10.1039/C4CP01740D
[36] White J C 1987 Tunable Lasers Berlin Springer pp. 115–207
[37] Shi J L Xu J Luo N N Wang Q Zhang Y B Zhang W W He X D 2019 Acta Phys. Sin. 68 044201 (in Chinese) https://doi.org/10.7498/aps.68.044201
[38] Graener H Seifert G Laubereau A 1991 Phys. Rev. Lett. 66 2092 https://doi.org/10.1103/PhysRevLett.66.2092
[39] Yui H Kato H Someya Y 2008 J. Raman Spectrosc 39 1688 https://doi.org/10.1002/jrs.2085
[40] Liu X L Sun S H Cao Y Sun M Z Liu Q C Hu B T 2013 Acta Phys. Sin. 62 045201 (in Chinese) https://doi.org/10.7498/aps.62.045201