† Corresponding author. E-mail:
We demonstrated a continuous wave (cw) single-frequency intracavity frequency-doubled Nd:YVO4/LBO laser with 532 nm output of 7.5 W and 
Continuous-wave (cw) single-frequency all-solid-state lasers with the features of low noise, good beam quality, and long coherent length have found applications in a number of fields, including quantum information, cold atom physics, and precise measurements.[1–9] In particular, a single-frequency laser source with high power dual-wavelength output is more beneficial to those investigations and measurements. For example, in the generations of squeezed states and entanglements at 


Although single frequency lasers with high power 
Intensity noise reduction and power stabilization were generally investigated simultaneously in previous works. When a feedback loop based on a combination of an electro-optical amplitude modulator (EOAM) or acousto-optic modulator (AOM) and a polarized beam splitter (PBS) was employed to stabilize the laser power, the laser intensity noise could be suppressed at the same time.[16–18] Unfortunately, both commercially available and custom made EOAMs or AOMs may lead to a beam quality deterioration of the incident 532 nm laser and the maximum permitted power density of the incident 532 nm laser for an EOAM is generally 0.5 W/mm2. Apart from this method, the laser intensity noise can also be reduced by utilizing a mode cleaner (MC) acting as a low-pass filter,[19,20] but the noise reduction band of the method using MC is restricted by the bandwidth of the MC. Unbalanced Mach–Zehnder interferometer (MZI) is a kind of device that can be used for laser noise suppressing in some discrete frequencies, but not in the audio-frequency region.[21,22] Consequently, some other method should be developed to build a laser source with low intensity noise in the Hz to kHz range and good power stability, which is of benefit to the generation of squeezed state in the audio-frequency region that can be used in the gravitational wave detection.
In this paper, we demonstrate a noise reduction and frequency stabilization system for an intracavity frequency-doubled laser with multi-Watts output. The configuration of the intracavity frequency-doubled laser to be optimized is simply described in section
The experimental setup of the high power cw single-frequency intracavity frequency-doubled laser and stabilization system is shown in Fig. 


The outputs of fundamental and second harmonic lasers are isolated from the laser resonator using two optical isolators (OIs) and separated using a dichroic mirror (DBS). The 
Based on our previous work on the modeling of the sufficient condition of stable single frequency laser operation with energy transfer upconversion and excited stimulated absorption taken into account,[23] and considering the power requirement for building the multi-partite entanglements and squeezed states, an output coupler (M5 in the laser cavity) with a transmission of 1.3% at 


 | Fig. 2. Output powers of 
|
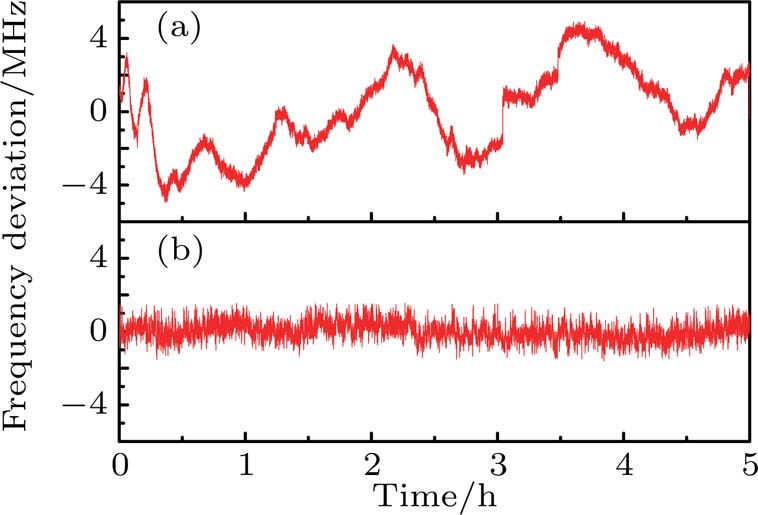
By using a digital oscilloscope (model: DPO7245, Tektronix) and a software based on Labview, the laser frequency deviation from the initial frequency as a function of time was measured and shown in Fig.
To stabilize the output power and suppress the intensity noise of the 532 nm laser, a MZI and the corresponding power stabilization loop (PSL) as shown in Fig. 
To investigate the influence of Tlock on the laser intensity noise property, the BSs with R = 50% were used to build the MZI, and the noise spectra were recorded when the OPD of the MZI was locked at different Tlock, as shown in Fig.
To test the influence of the beam splitting ratio on the intensity noise of the 532 nm laser, three MZIs with R = 90%, 75%, and 50% were used for 532 nm laser stabilization. Figure
 | Fig. 5. Intensity noise of laser as a function of analysis frequency with different R of MZI at Tlock of 85%. |
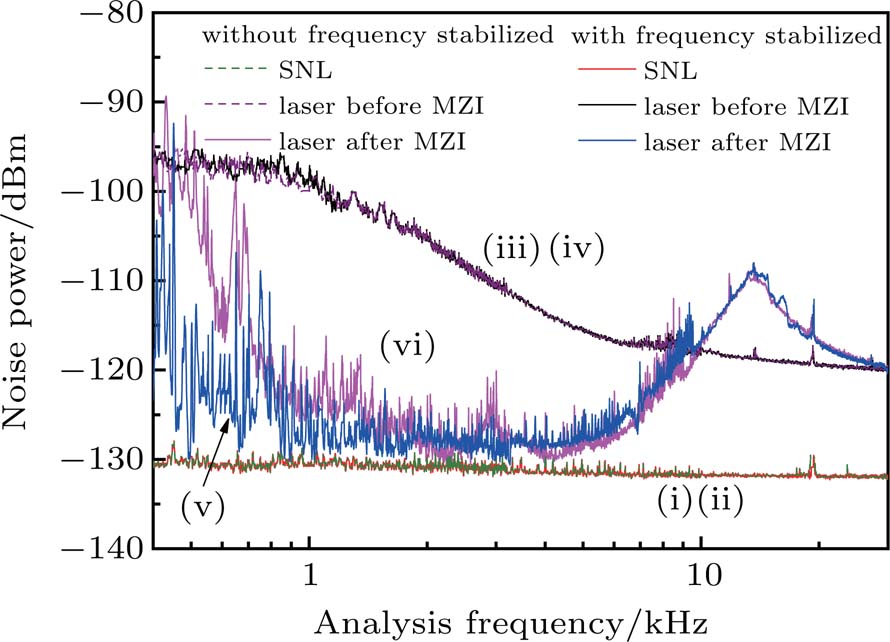
The influence of laser frequency stabilization on the intensity noise suppression was also measured and shown in Fig.
 | Fig. 6. Intensity noise of laser as a function of analysis frequency in the cases with or without laser frequency stabilization when R = 90% and Tlock=85%. |
From the above experiment results, the best noise performance was achieved when the laser was frequency stabilized, the MZI with R = 90% was employed and locked to the state of Tlock = 85%. The performance of laser power stability at the same condition was also measured, as shown in Fig.
We built up a high power mode-hop-free cw single-frequency intracavity frequency-doubled Nd:YVO4/LBO laser, the output power and intensity noise in the audio frequency region of 532 nm laser were stabilized and suppressed via a locked MZI. By utilizing the resonant frequency of a temperature controlled confocal F–P cavity as frequency standard, the frequencies of the dual-wavelength laser were locked via PDH technique, and the measured frequency drift of the 

| [1] | |
| [2] | |
| [3] | |
| [4] | |
| [5] | |
| [6] | |
| [7] | |
| [8] | |
| [9] | |
| [10] | |
| [11] | |
| [12] | |
| [13] | |
| [14] | |
| [15] | |
| [16] | |
| [17] | |
| [18] | |
| [19] | |
| [20] | |
| [21] | |
| [22] | |
| [23] |


