Model of output characteristics of giant magnetoresistance (GMR) multilayer sensor
Zhang Jiao-Feng1, Qian Zheng-Hong1, 2, †, Zhu Hua-Chen2, Bai Ru2, Zhu Jian-Guo1
School of Materials Science and Engineering, Sichuan University, Chengdu 610041, China
Center for Integrated Spintronic Devices, Hangzhou Dianzi University, Hangzhou 310018, China


† Corresponding author. E-mail: zqian@hdu.edu.cn

Abstract

In this paper, the giant magnetoresistance (GMR) multilayer sensor is fabricated with a Wheatstone bridge, and it exhibits excellent performance with a sensitivity of 2.8349 mV/(V/Oe) ( ) and a saturation field of 26 Oe along the sensitive axis. The GMR sensor is also characterized in a high magnetic field. The sensitivity decreases from 2.8349 mV/(V/Oe) at an angle of 0° to 0.0175 mV/(V/Oe) at an angle of 90°. Then, the sensor is placed in a series of rotating magnetic fields. We propose a model to express the output characteristics of the GMR multilayer sensor. The transfer curves of the sensor can be shown as two exactly symmetrical circles with an increasing radius when the magnetic field increases. The experimental results are consistent with the simulation results of the model. The advantage of this model is that it is simpler and more intuitive.

1. Introduction

Since its discovery in 1988, the giant magnetoresistance (GMR) effect has been widely studied from both academic and technological viewpoint[113] because of its advantages such as high sensitivity, large magnetoresistance ratio, and good compatibility with standard integrated circuit processes. The GMR sensor was first industrialized by NVE in 1994 and has been well used in medical and industrial circles, automotive electronics, etc.[1419] As a type of magnetic sensing device, the GMR sensor can be used as an angular transducer in the electronic compass, a pedal position detector in vehicles, and an angle encoder in industrial controls[2025] to replace the Hall-effect device and anisotropic magnetoresistance (AMR) sensor.[26,27] The angular dependence of Hall-effect device, AMR sensor and GMR spin-valve sensor have been thoroughly investigated in recent years.[7,2832] The angular dependence of the GMR multilayer film has been reported.[3338] This dependence was introduced via the angular variation of transmission and reflection coefficient in Fuchs–Sondheimer boundary conditions.[34,39] The angular dependence of the GMR multilayer film has been systematically and theoretically studied in depth by Vedyayev et al..[39] They presented an analytical quantum-statistical theory of the angular variation of the GMR in magnetic multilayers, in which both the spin-dependent scattering of conduction electrons and the spin-dependent potential barriers between successive layers are taken into account.[20] However, the angular dependence of the GMR sensor based on the GMR multilayer film was rarely reported.[40,41] It is found that the GMR sensor is sensitive to angular variation and can be described with a cosine function.

In this paper, the output characteristics of the sensor are further analyzed, and the angular dependence of the GMR multilayer sensor is studied. First, the magnetic field direction, which is at an angle with respect to the sensitivity axis, is changed. The sensitivity of the GMR multilayer sensor is studied. Second, a series of rotating magnetic fixed fields is applied at different directions from 0° to 360°. Most importantly, a model is proposed to further describe the output characteristics of the GMR multilayer sensor. This model has not been reported in other papers. It differs from that in the work by Zhu,[43] where only a series of rotating magnetic fixed fields is used, and a simple modified model is proposed to describe the output characteristics of the GMR multilayer sensor.

2. Experiment

In this work, the GMR multilayer films were deposited on Si/SiO2 ( ) substrates by a Nordiko 9606 sputtering system with a base pressure of Torr (1 Torr = 1.33322×10² Pa), and the GMR multilayer film sensor was subsequently fabricated with a series of device processes including resistor patterning, NiFe plating, passivation and pad opening. The GMR multilayer film had a structure of (NiFeCr (4.5 nm)/NiFe (4 nm)/[NiFe (5 nm)/Cu (0.9 nm)/NiFe (3.5 nm)]3/NiFeCr(5 nm)) with a matrix of 4.5-nm-thick NiFeCr layer and 5-nm-thick NiFeCr layer as the buffer and cap layer. In the NiFe/Cu/NiFe layer structure with NiFeCr layer as a buffer layer, the antiferromagnetic coupling could be well established, so that a good GMR effect was obtained. It also exhibited good thermal stability, making it suitable for practical use in sensor devices.

Figure 1(a) shows the schematic of the GMR sensor with a structure of Wheatstone bridge, which consists of four patterned serpentine GMR multilayer resistors: R1, R2, R3, and R4, in which R2 and R4 were shielded by NiFe thick films, which make the resistors immune to an external field, whereas R1 and R3 were placed in the gap of the shielding layers and exposed to a magnetic field. When an external magnetic field was applied, the Wheatstone bridge of the sensor became unbalanced and produced a differential output voltage signal. In this structure, the shielding layers were also used as a flux concentrator, which amplifies the magnetic field in the gap. Although the Wheatstone bridge had a favorable compensation for those effects, the saturation magnetic field and sensitivity of the sensors were still affected by the temperature, which cannot be neglected in practical tests. Thus, the experimental temperature was maintained at 27°C. The topology structure of the processed sensor is shown in Fig. 1(b). Then, the sensor die was packaged as SOP8 before being tested and analyzed.

Fig. 1. (a) Wheatstone bridge configuration, and (b) topology structure of the sensor.

Two test systems were employed in this work. In the measurement of the low magnetic field range, a Helmholtz coil was used to produce the magnetic fields in a range from −50 Oe to +50 Oe. The Helmholtz coil system consists of a two-dimensional (2D) Helmholtz coil and a device fixture. In the measurement, the sensor under test was fixed on the device fixture, and the sensor transfer curve was obtained by sweeping the magnetic fields by changing the current in the Helmholtz coil. The current source for the Helmholtz coil is controlled by a computer, which adjusts the sweeping range and controls the direction of the magnetic fields. The angle between the direction of the magnetic field and the sensitive axis of the sensor is denoted as θ, as shown in Fig. 2. Figure 2 is combined with Fig. 1(b), where the sensitive axis is along the long side of the GMR sensor. The supply voltage was 3.0 V, and the system could capture the output of the sensor and store it. In the measurement of a high magnetic field range, the high-magnetic-field probe was used to measure the magnetic fields in a range from −2000 Oe to +2000 Oe. The high-magnetic-field probe consisted of a pair of horizontally opposed electromagnets, a device fixture, and a Gaussmeter. The magnetic fields generated by electromagnets were calibrated by the Gaussmeter in advance. The measurement procedure was similar to that for the Helmholtz coil test.

Fig. 2. Definition of angle θ.

In this work, first, the transfer curves of the GMR sensor were acquired by sweeping the external magnetic field from −50 Oe to +50 Oe in steps of 0.25 Oe along the sensitive axis. Second, the transfer curves of the GMR sensor were recorded by sweeping the external magnetic field from −2000 Oe to +2000 Oe in steps of 50 Oe along the sensitive axis. Third, the transfer curves of the GMR sensor were acquired by sweeping the external magnetic field with different angles with respect to the sensitive axis, from −50 Oe to +50 Oe. Finally, the rotation transfer curves of the GMR multilayer sensor were acquired by a rotating field. The magnitudes of the fields were 6.0 Oe, 10.0 Oe, 14.0 Oe, and 26.0 Oe.

3. Results and discussion
3.1. Transfer curves and characteristics

The transfer curves of the GMR sensor is shown in Fig. 3. The enlarged partial drawing of Fig. 3 is acquired by sweeping the external magnetic field from −50 Oe to +50 Oe. The GMR sensor exhibits a sensitivity of 2.8349 mV/(V/Oe) in the linear range, and the hysteresis and nonlinear error of the sensor are 0.2869% and 0.1436%, respectively. The bridge offset of the sensor is 0.02 mV/V. The output of the sensor linearly increases as magnetic field increases from 0 Oe to 26 Oe because R2 and R4 are shielded by thick NiFe films, R1 and R3 are exposed to the magnetic field, and their resistances increase with increasing magnetic field. When the magnetic field increases from 26 Oe to 50 Oe, the output voltage of the sensor begins to be saturated and remains unchanged.

Fig. 3. Transfer curves of the sensor in measurement of low magnetic field.

The output voltage of the sensor remains steady in a range from 50 Oe to 750 Oe. When the magnetic field changes from 750 Oe to 1250 Oe, the output voltage decreases with external increasing magnetic field. Then, the output voltage maintains a steady value, which is identical to the field at 0 Oe, when the field is larger than 1250 Oe.

In the range of 26 Oe–750 Oe, a platform is shown in the transfer curve. The MR ratio of R1 to R3 is saturated, and R2 and R4 are shielded. Thus, in the range of 750 Oe–1250 Oe, the imbalance of the Wheatstone bridge output is inversely proportional to the magnetic field because R1 and R3 maintain the steady minimum values, and the effect of the shielding layer on R2 and R4 gradually disappears. After the final phase, the output voltage remains at the steady minimum values with the increase in magnetic field because R2 and R4 decrease to a minimum value, and the MR ratio of R1 to R3 remains saturated.

3.2. Angular dependence

The transfer curves of the GMR sensor are shown in Fig. 4, where angle θ changes to 0°, 30°, 50°, and 70° in sequence. The transfer curve of the sensitivity versus angle is shown in Fig. 5. The rotation transfer curves of the GMR sensor are shown in Fig. 6, which are obtained at fixed applied fields of 6.0 Oe, 10.0 Oe, 14.0 Oe, and 26.0 Oe, respectively.

Fig. 4. Transfer curves of the tested sensor at different values of angle θ.
Fig. 5. Sensitivity versus angle of sensor in a range of 0°–90° in steps of of 5°.
Fig. 6. Rotation transfer curves of sensor at different rotating fields: 6 Oe, 10 Oe, 14 Oe, and 26 Oe.

As shown in Fig. 4, the saturation field of the sensor increases with increasing θ because the magnetic field component along the direction of the sensitive axis decreases with increasing angle θ. The magnified part for each of the curves in Fig. 4 shows that there is a deviation between the forward curve and the reverse curve due to the hysteresis effect (see the inset in Fig. 4). The hysteresis remains relatively stable except at 70°. When the magnetic field is low, the error of the magnetic field cannot be ignored due to the inaccurate calibration of the test equipment when the magnetic field is settled. Because the magnetic field component perpendicular to the sensitive axis of the sensor gradually increases with increasing angle θ, the error is magnified.

The theoretical angular characteristic of the GMR sensor with the Wheatstone bridge structure is described as

Here, VDD is the power voltage, which is set to be 3.0 V in this experiment, S is the typical sensitivity along the sensitive axis, and H is the magnitude of the magnetic field. As shown in Eq. (1), the typical sensitivity is proportional to the slope of the linear range when the power voltage is set to be a fixed voltage. The sensitivity is changed with angle θ because the magnetic field component along the direction of the sensitive axis depends on angle θ. The actual sensitivity can be defined by the typical sensitivity multiplied with . Compared with the results obtained by Cubells–Beltrán[43] from a spin-valve GMR sensor in 2016, the sensitivity can be improved by reducing the linear range of the GMR sensor. Theoretically, the sensitivity is 0 mV/(V/Oe) at an angle of 90°. However, the sensitivity decreases from 2.8349 mV/(V/Oe) at 0° to 0.0175 mV/(V/Oe) at 90° as shown in Fig. 5. In application, the error of the bridge offset Voffset and nonlinear error cannot be ignored because of the resistance differences among the resistors in Wheatstone bridge. Thus, in this case, this simple equation (1) is not accurate considering the nonnegligible effects in application.

As shown in Fig. 6, in the saturation region of 26 Oe, the angular transfer curve of the GMR sensor can be shown as a cosine function in a region from 0° to 360°, and the linear region for sensor applications is 59°. The effect disappears at a higher field after the saturation region of 26 Oe because the shielded resistors R2 and R4 are not well shielded after the shield layer has been saturated. Simultaneously, the effect of the shield layer as a flux concentrator decreases with increasing magnetic field. The saturation should be avoided in practical applications. Therefore, in this paper, the model is only considered in the linear region because no suitable models are applicable for the saturation region.

3.3. Model establishment and analysis

Considering the bridge offset Voffset and nonlinear error , the simple model in Eq. (1) can be modified by

The performance parameters of the sensor are as follows: Voffset = 0.02 mV, , S = 2.8349 mV/(V/Oe), and VDD = 3.0 V.

To analyze the output characteristics of the GMR sensor, a simple model (1) was proposed in the last century and has been widely studied.[29,40,43] We propose a model to analyze the angular dependence of the GMR multilayer sensor.

Let , and , then the relationship between X and Y will be

Let , , , then we will have
When
When ,

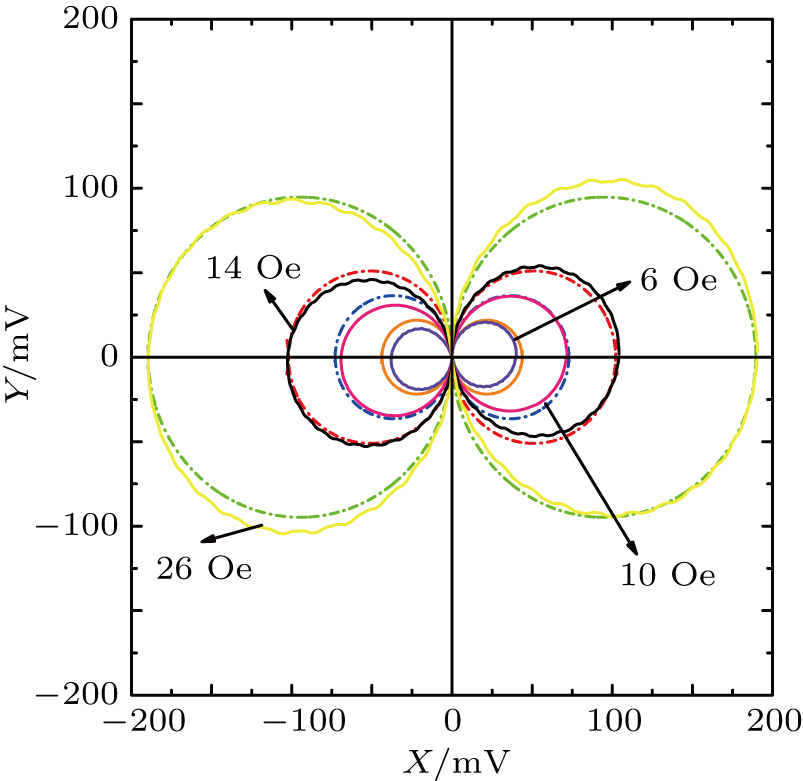
Equations (6) and (8) show that when the applied field H is not saturated ( Oe), the relational curve of X and Y is extremely close to two exactly symmetrical circle-like shapes, as evidenced by the experimental results in Fig. 7. The radius is determined by half the sum of the maximum output voltage, the bridge offset Voffset and the nonlinear error of the corresponding magnetic field, and the two origins are ( )).

Fig. 7. Transfer curves of the sensor at different magnitudes of the rotating field: 6.0 Oe, 10.0 Oe, 14.0 Oe, and 26.0 Oe.

The relationship between X and Y is simulated using MATLAB. The magnitudes of the rotating magnetic field are assumed to be 6.0 Oe, 10.0 Oe, 14.0 Oe, and 26.0 Oe. Figure 8 shows the simulation results of the relationship between X and Y at different magnitudes of the rotating field, showing that the experimental results can fit the model prediction well. The simulation results show that the increase of the magnitude of the rotating magnetic field constantly changes the radius of the relationship between circles of X and Y, and the radius increases with increasing rotating field intensity.
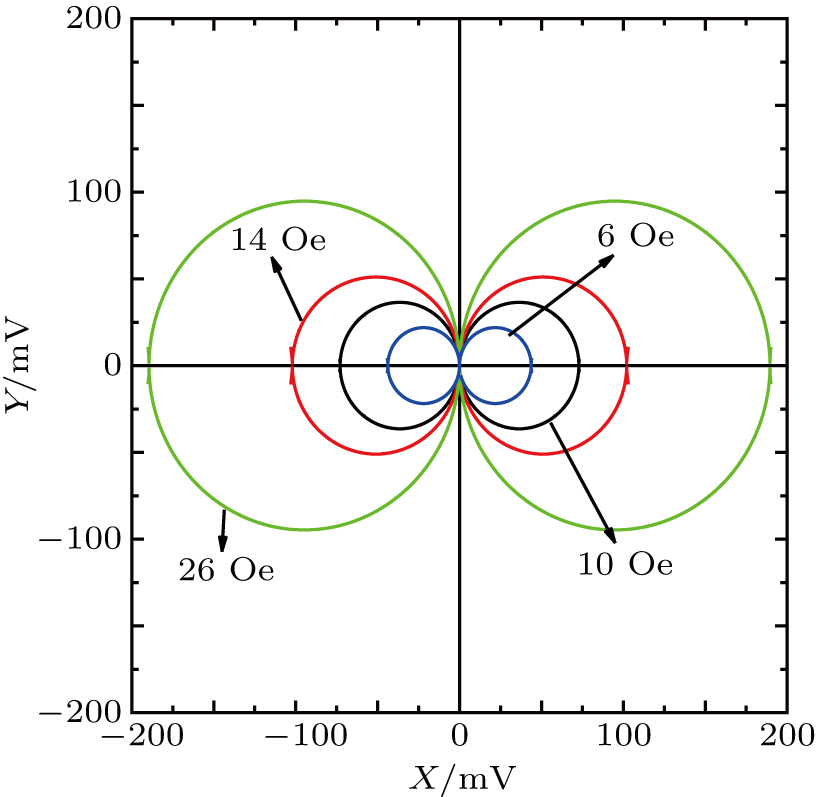
Fig. 8. Simulation results of relationship of X and Y at different magnitudes of rotating field: 6.0 Oe, 10.0 Oe, 14.0 Oe, and 26.0 Oe.

Figure 9 shows the comparison between the experimental results and the simulation results. The experimental results are plotted with the solid line, and the dash dotted line is for the simulation results. The differences between the experimental results and the model prediction are not small for the saturation field of 26 Oe. The advantage of this model is that it is simpler and more intuitive. In this model, although the angle is not explicitly expressed, the output characteristics of the sensor can be clearly displayed with the changes of the angle in different magnetic fields through data pictures. As shown in Fig. 7, the distance from any point on the curve to the origin represents the output voltage. The abscissa and ordinate of any point on the curve are indicated by the output voltage of the sensor in two directions: parallel ( ) and perpendicular ( ) to the sensitive axis at a certain magnetic field with any angle.

Fig. 9. Experimental results versus simulation results, for applied magnetic fields of 6.0 Oe, 10.0 Oe, 14 Oe, and 26 Oe.
4. Conclusions

In this paper, the properties of the GMR multilayer sensor are analyzed and the angular dependence of the GMR sensor is characterized. The sensor exhibits excellent performance with a sensitivity of 2.8349 mV/(V/Oe) and a saturation field of 26 Oe along the sensitive axis. The GMR sensor in a high magnetic field is also characterized. The sensitivity decreases from 2.8349 mV/(V/Oe) at 0° to 0.0175 mV/(V/Oe) at 90°. Then, a model is proposed to describe the output characteristics of the GMR sensor. The equation consists of two exactly symmetrical circles in the saturation field of 26 Oe, and the experimental results are consistent with the simulation results. The advantage of this model is that it is simpler and more intuitive, and it can be applied to the research of two-dimensional sensors.

Reference
[1] Daughton J Brown J Chen E Beech R Pohm A Kude W 1994 IEEE Trans. Magn. 30 4608 https://doi.org/10.1109/20.334164
[2] Ene C B Schmitz G Kirchheim R Andreas Hütten 2005 Acta Mater. 53 3383 https://doi.org/10.1016/j.actamat.2005.03.038
[3] Li J Qian Z Sun Y Bai R Zhu J 2013 IEEE Sens. J. 13 4944 https://doi.org/10.1109/JSEN.2013.2272461
[4] Kuru H Kockar H Alper M 2017 J. Magn. Magn. Mater. 444 132
[5] Lu S Shang J X Zhang Y 2007 Chin. Phys. Lett. 24 3229 https://doi.org/10.1088/0256-307X/24/11/057
[6] Li S T Liu X Shi W K Cao J W Wei F L Wei D 2009 Chin. Phys. B 18 1643 https://doi.org/10.1088/1674-1056/18/4/060
[7] Tao X Xia K 2011 Acta Phys. Sin. 60 127202 (in Chinese) https://doi.org/10.7498/aps.60.127202
[8] Zhou S M Chen F L 2012 Chin. Phys. Lett. 29 047501 https://doi.org/10.1088/0256-307X/29/4/047501
[9] Pang Z Y Chen Y X Liu T T Zhang Y P Xie S J Yan S S Han S H 2006 Chin. Phys. Lett. 23 1566 https://doi.org/10.1088/0256-307X/23/6/058
[10] Wang G H Hang Z D Xuan H C Mang S C Cheng S Y Zhang C L Du Y W 2013 Chin. Phys. B 22 77506 https://doi.org/10.1088/1674-1056/22/7/077506
[11] Tong P Wang B S Sun Y P 2013 Chin. Phys. B 22 67501 https://doi.org/10.1088/1674-1056/22/6/067501
[12] Sun J F Xing D W Zhang S L 2010 Chin. Phys. B 19 77502 https://doi.org/10.1088/1674-1056/19/7/077502
[13] Bai R Qian Z H Zhu H C Li Q L Li Y Peng Y Z Huo D X 2016 IEEE Trans. Magn. 53 1 https://doi.org/10.1109/TMAG.2018.2792846
[14] Cubells-Beltran María Dolores Reig C Munoz Diego Ramírez 2009 IEEE Sens. J. 9 1756 https://doi.org/10.1109/JSEN.2009.2030880
[15] Reig C María-Dolores Cubells-Beltran Diego Ramírez Muñoz 2009 Sensors 9 7919 https://doi.org/10.3390/s91007919
[16] Kang W Ran Y Lv W Zhang Y Zhao A 2017 IEEE Magn. Lett. 7 1 https://doi.org/10.1109/lmag.2016.2604205
[17] Jaiswal A Chakraborty I Roy K 2017 IEEE Magn. Lett. 8 1 https://doi.org/10.1109/lmag.2017.2712685
[18] Qian L J Hu J G Xu X Y 2009 Chin. Phys. B 18 2589 https://doi.org/10.1088/1674-1056/18/6/078
[19] Li S T Liu X Shi W K Cao J L Wei F L Wei D 2009 Chin. Phys. B 18 1643 https://doi.org/10.1088/1674-1056/18/4/060
[20] Smith N Zeltser A M Parker M R 1996 IEEE Trans. Magn. 32 135 https://doi.org/10.1109/20.477563
[21] Djamal M Ramli 2012 Procedia Eng. 32 60 https://doi.org/10.1016/j.proeng.2012.01.1237
[22] Lisa L Daniel K Rahel K Johannes R Piriya T Anja W 2015 Sensors 15 28665 https://doi.org/10.3390/s151128665
[23] Reig C María-Dolores Cubells-Beltrán 2016 High Sensitivity Magnetometers 2 Berlin, Germany Springer 225 252 https://doi.org/10.1007/978-3-319-34070-8_8
[24] Yan S Cao Z Guo Z Zhenyi Z Anni C Yue Q 2018 Sensors 18 1832 https://doi.org/10.3390/s18061832
[25] Qian Z Wang D Daughton J M Tondra M Nordman M Popple A 2004 IEEE Trans. Magn. 40 2643 https://doi.org/10.1109/TMAG.2004.830212
[26] Nakatani T Li S Sakuraba Y Furubayashi T Hono K 2018 IEEE Trans. Magn. 54 1 https://doi.org/10.1109/TMAG.2018.2889566
[27] Lacour D Katine J A Smith N Carey M J 2004 Appl. Phys. Lett. 85 4681 https://doi.org/10.1063/1.1819516
[28] Lenz J Edelstein A S 2006 IEEE Sens. J. 6 631 https://doi.org/10.1109/JSEN.2006.874493
[29] Li X Zhou Y Zheng C Chan P H Chan M Pong P W T 2016 Appl. Phys. Lett. 109 192402 https://doi.org/10.1063/1.4967175
[30] Wu S B Chen S Li H Yang X F 2012 Acta Phys. Sin. 61 97504 (in Chinese) https://doi.org/10.7498/aps.61.097504
[31] Qian L J Xu X Y Hu J G 2009 J. Funct. Mater. Dev. 18 2589 https://doi.org/10.1088/1674-1056/18/6/078
[32] Kang M H Choi B W Koh K C Lee J H Park G T 2005 Sens. Actuator A-Phys. 118 278 https://doi.org/10.1016/j.sna.2004.09.002
[33] Zhang S Levy P M Fert A 1992 Physica B 45 8689 https://doi.org/10.1103/physrevb.45.8689
[34] Camley R E Barnas J 1989 Phys. Rev. Lett. 63 664 https://doi.org/10.1103/PhysRevLett.63.664
[35] Parent F Tuaillon J Stern L B Dupuis V Prevel B Perez A Melinon P Guiraud G Morel R Barthélémy A Fert A 1997 Phys. Rev. B 55 3683 https://doi.org/10.1103/physrevb.55.3683
[36] Taniguchi T Imamura H 2011 Phys. Rev. B 83 054432 https://doi.org/10.1103/physrevb.83.054432
[37] Wang K Zhang S Levy P M 1996 Phys. Rev. B 54 11965 https://doi.org/10.1103/physrevb.54.11965
[38] Miller B H Chen E Y Dahlberg E D 1993 J. Appl. Phys. 73 6384 https://doi.org/10.1063/1.352658
[39] Vedyayev A Dieny Ryzhanova N Genin J Cowache C 1994 Epl. 25 465 https://doi.org/10.1209/0295-5075/25/6/012
[40] Zhu H Qian Z Huang C 2011 1st Int. Symp. Spintronic Devices Commercialization (ISSDC) October 21–24, 2010 Beijing 263
[41] Sun Y C Qian Z H Bai R Zhu H C 2013 Adv. Mater. Res. 662 746 https://doi.org/10.4028/www.scientific.net/AMR.662.746
[42] María-Dolores Cubells-Beltrán Reig Càndid Jordi M Joana S Susana C 2016 Sensors 16 939 https://doi.org/10.3390/s16060939
[43] Du Y Pong P W T 2016 5th International Symposium on NexGeneration Electron (ISNE) May 4–6, 2016 Hsinchu, Taiwan 2 https://doi.org/10.1109/isne.2016.7543348