Mask-based denoising scheme for ghost imaging
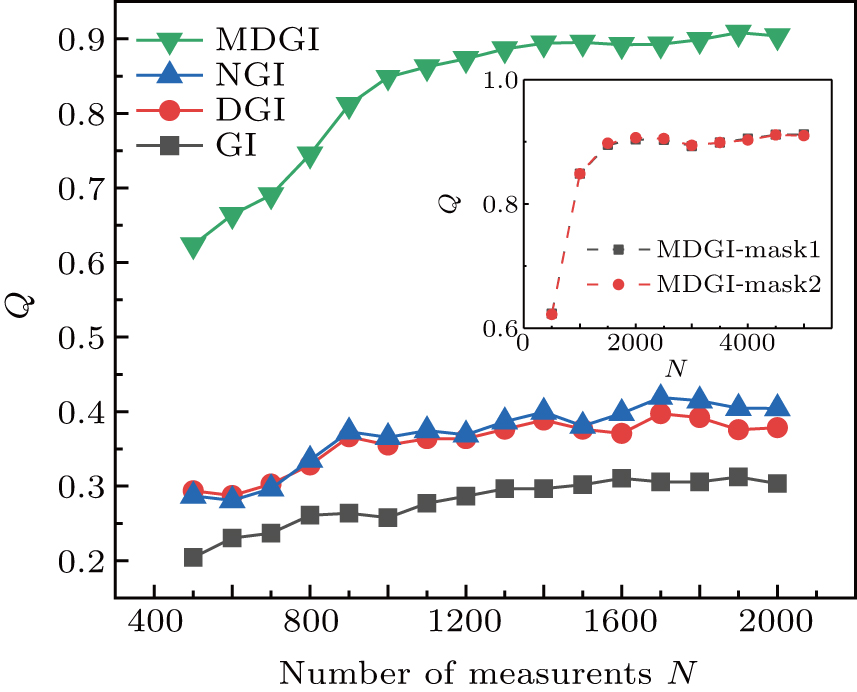
Relationships between the number of measurements and Q value for reconstructed binary image “double-slit” under different GI methods. Inset indicates the comparison between MDGI based on the same mask1

Mask-based denoising scheme for ghost imaging |
|
Relationships between the number of measurements and Q value for reconstructed binary image “double-slit” under different GI methods. Inset indicates the comparison between MDGI based on the same mask1 |
 |