Grain boundary restructuring and La/Ce/Y application in Nd–Fe–B magnets
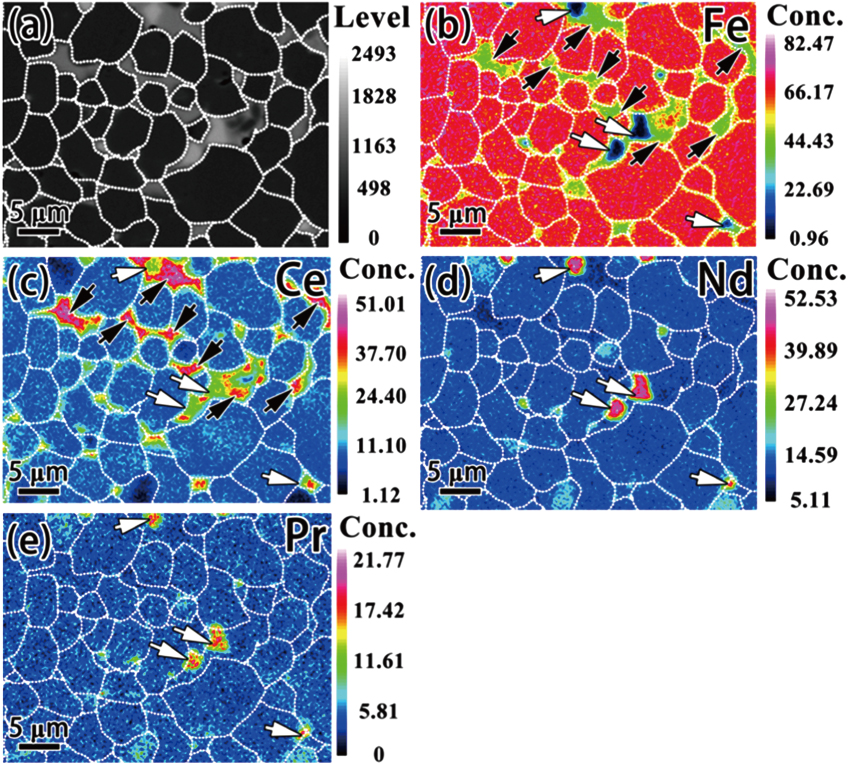
(a) Back-scattered SEM image and the corresponding elemental concentration distribution mappings of (b) Fe, (c) Ce, (d) Nd, and (e) Pr. The brighter contrast in (a) is the RE-rich phase, and the darker contrast reflects the 2:14:1 matrix phase. The white dashed lines illustrate the GBs and are guide for eyes. The black arrows in (b) and (c) indicate the Ce concentrated RE-rich triple junctions with relatively higher Fe content, while the white arrows indicate Pr/Nd/Ce concentrated RE-rich triple junctions with lower Fe content.[