Direct observation of the f–c hybridization in the ordered uranium films on W(110)
Chen Qiuyun, Tan Shiyong, Feng Wei, Luo Lizhu, Zhu Xiegang, Lai Xinchun
       

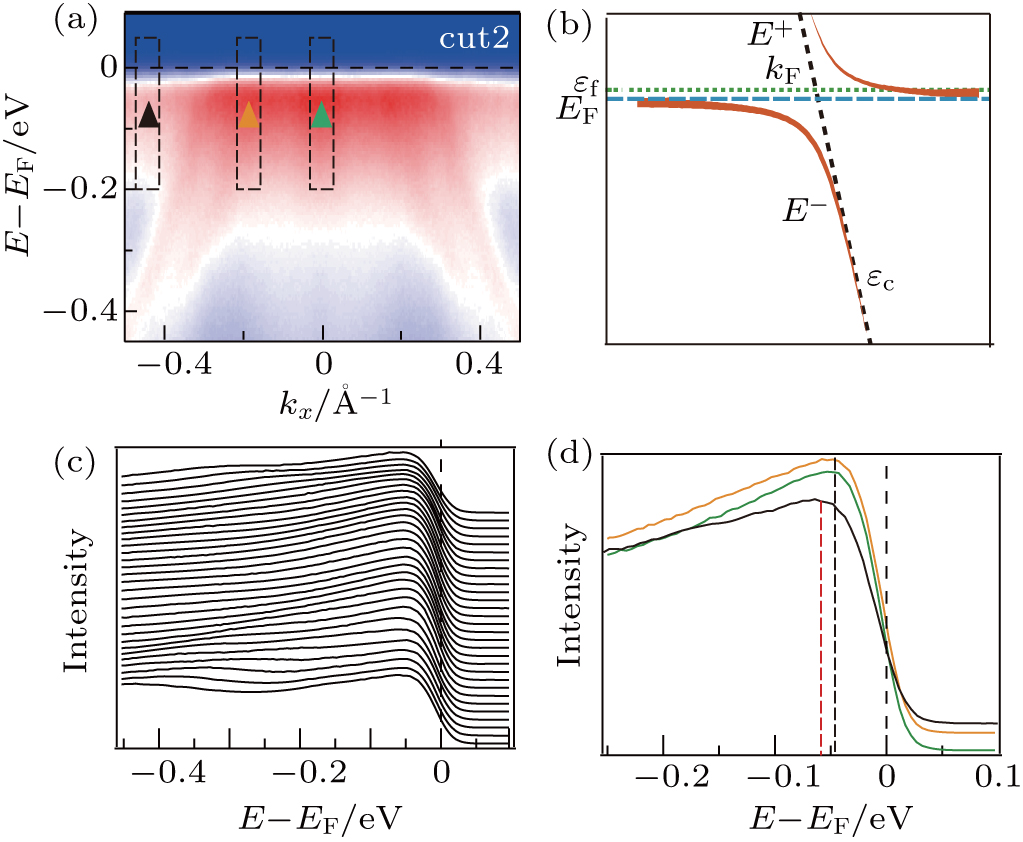
(a) Photoemission intensity plot along cut2 in Fig. 3(c). (b) A schematic diagram showing the hybridization process of the f bands ( ε f ) and a conduction band ( ε c ) in panel (c) under a periodic Anderson model in the Kondo lattice. The red curve is the hybridized band. (c) Energy distribution curves of the plot in (a). (d) Comparison of EDCs measured at different momentum locations. The black, yellow, and green curves represent the integration windows marked by the dashed blocks with the corresponding colors.