Evolution of incommensurate superstructure and electronic structure with Pb substitution in (Bi2−xPbx)Sr2CaCu2O8+δ superconductors
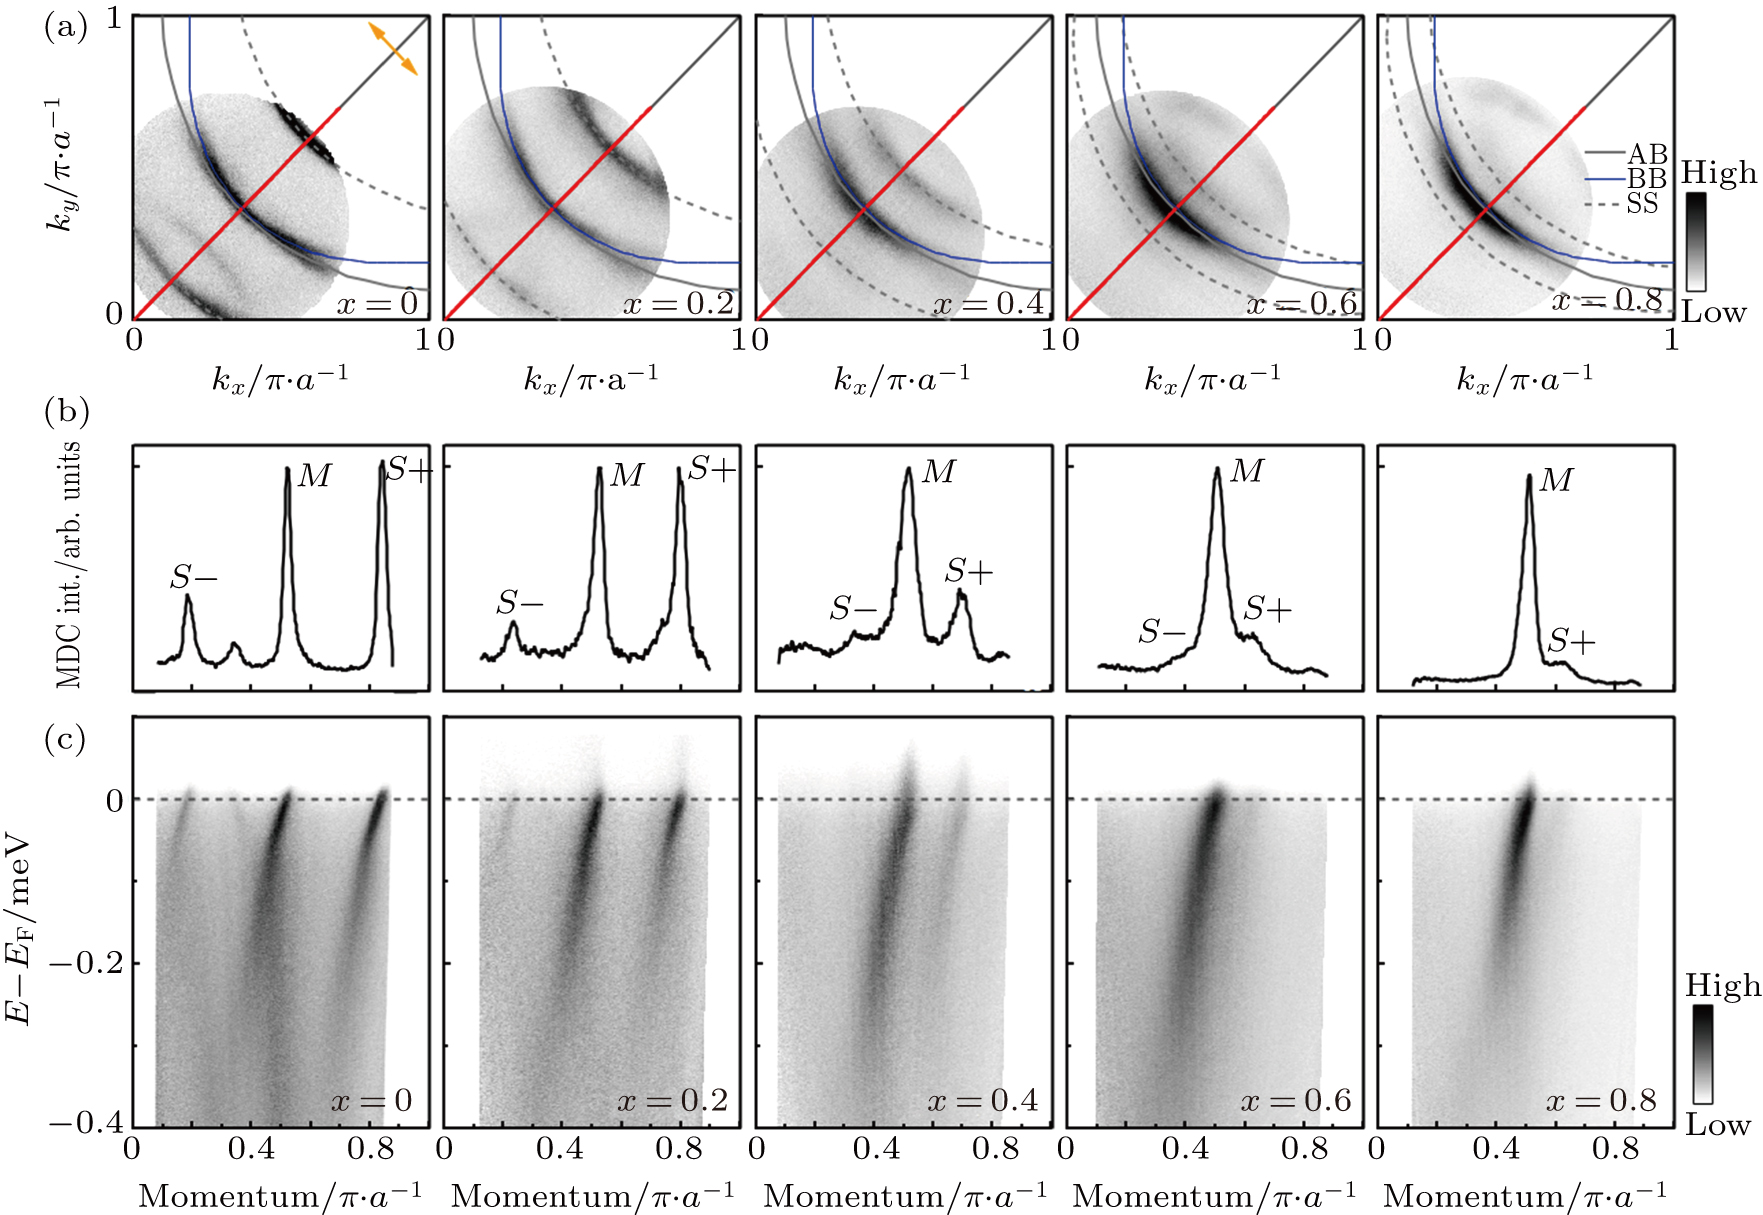
Fermi surface mapping and band structure of Pb-Bi2212 measured with 10.897 eV laser. (a) Fermi surface mappings for Pb-Bi2212 with various Pb contents (left to right panels correspond to x = 0, 0.2, 0.4, 0.6, and 0.8, respectively) measured at a temperature of 25 K using a laser of photon energy 10.897 eV. Here x = 0 sample is overdoped Bi2212 with Tc=81 K. Each image is obtained by integrating measured spectral weight within [−1, 1] meV energy window with respect to the Fermi level as a function of kx and ky. Orange double arrows represent the electric field vector direction of the incident laser. The grey and blue solid lines are the guides to the main antibonding (AB) and bonding (BB) Fermi surface sheets, respectively, while the dashed lines represent the first-order superstructure (SS) replicas. (c) Band structures measured along the nodal direction for the five samples. The locations of the momentum cuts are marked in (a) by red lines. The corresponding momentum distribution curves at the Fermi level are shown in (b). The M peak represents the main band while S−and S+ peaks represent two superstructure bands on the left and right sides of the main band, respectively.