Adsorption behavior of triphenylene on Ru(0001) investigated by scanning tunneling microscopy
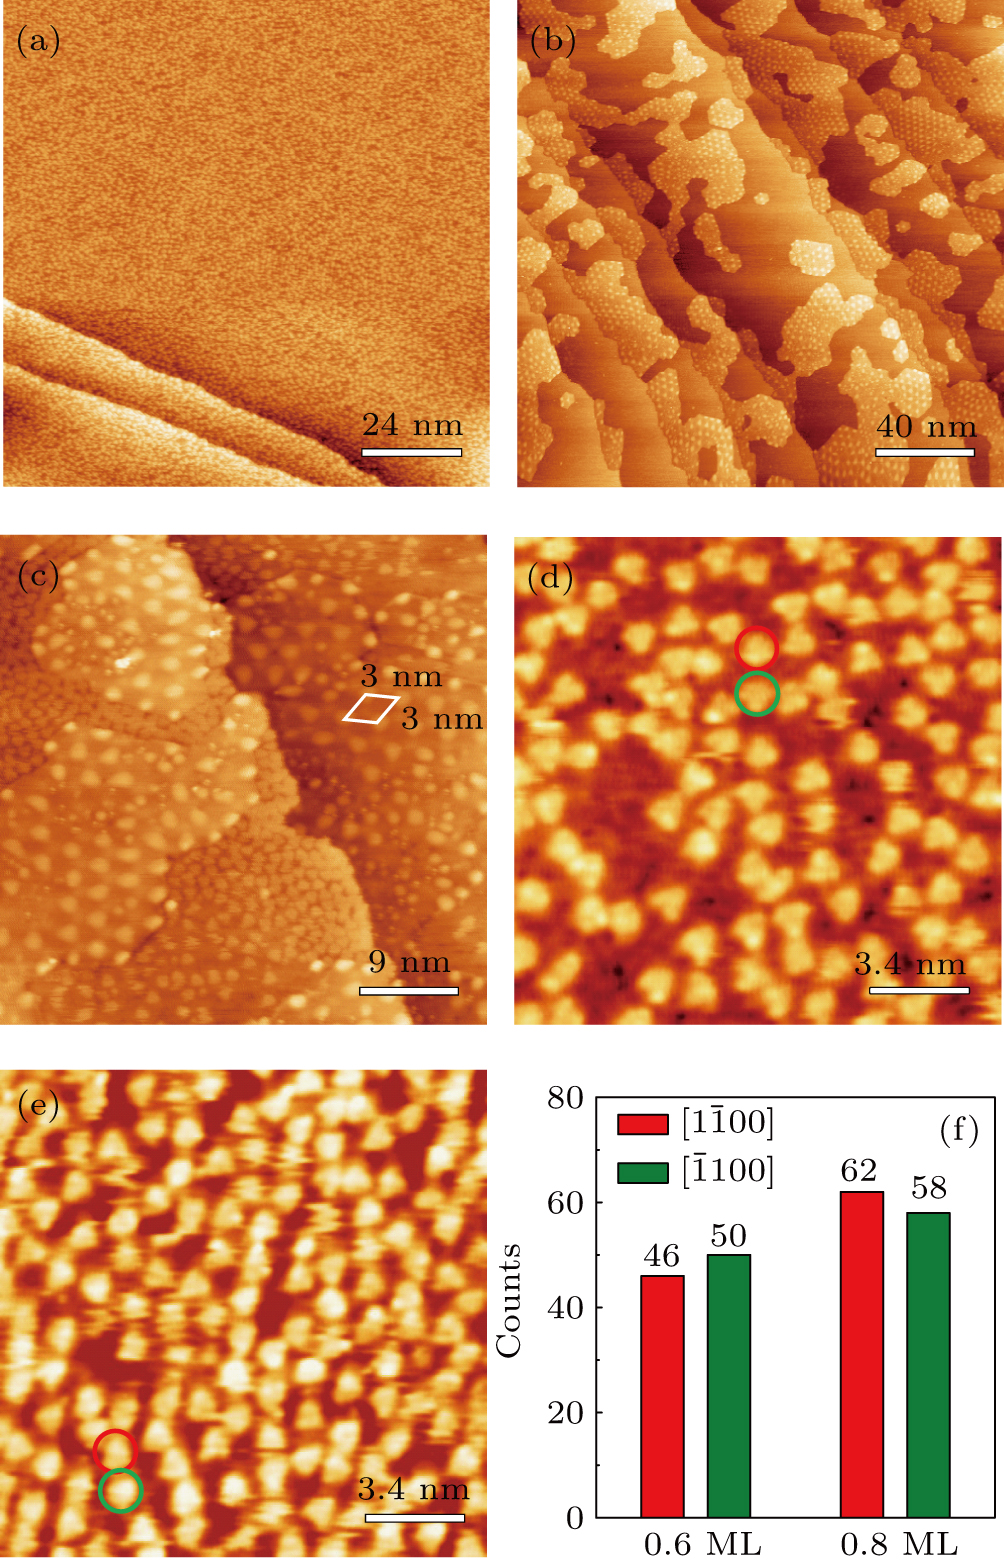
(a) Large-scale STM image of ∼1.0 ML of TP overlayer on the bare Ru(0001) surface (120 nm×120 nm, Vtip =-0.224 V, I = 0.152 nA). (b) STM image of graphene islands on Ru(0001) with typical Moiré patterns after annealing the sample at 700 K (200 nm ×200 nm, Vtip =−0.156 V, I = 0.309 nA ). (c) STM image for further deposition of TP molecules onto the substrate, showing partially high coverage of TP on the bare Ru(0001) surface constrained by a few graphene islands (the Moiré unit cell is sketched by a rhombus) and the step edges (45 nm×45 nm, Vtip =−0.086 V, I = 0.617 nA). (d) STM image of 0.6 ML of TP molecules on Ru(0001) with two molecular orientations identified, indicated by red and green circles (they also apply to (e)) (17 nm×17 nm, Vtip =−0.073 V, I = 0.071 nA). (e) STM image of 0.8 ML of TP molecules on Ru(0001) (17 nm×17 nm, Vtip =−0.358 V, I = 0.114 nA). (f) The histogram counts of molecules corresponding to two molecular orientations at TP coverages of 0.6 ML and 0.8 ML.