Semiconductor–metal transition in GaAs nanowires under high pressure
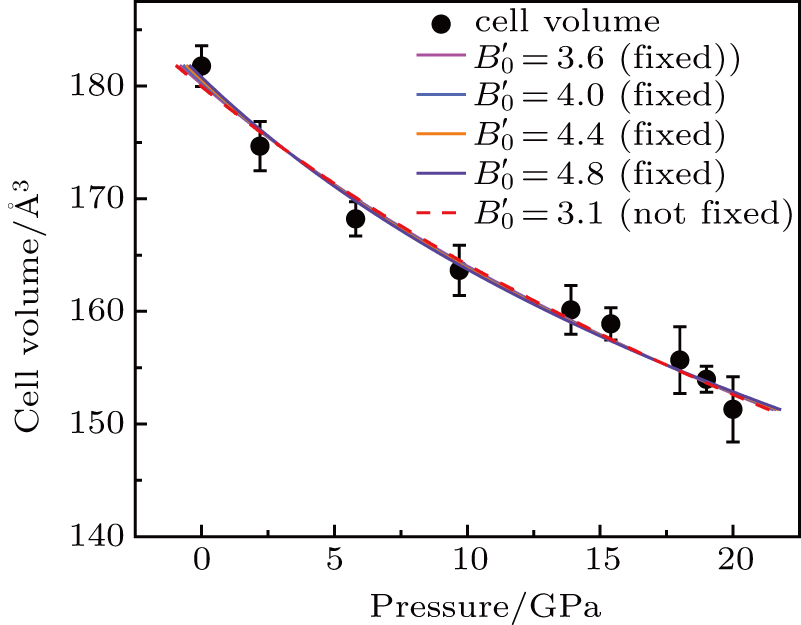
Pressure–volume diagram of GaAs NWs. The black-solid circles represent the experimental data. The various color solid lines are the fitting results generated via the third-order Birch–Murnaghan equation of state with different fixed
