Influence of vibration on spatiotemporal structure of the pattern in dielectric barrier discharge
Han Rong, Dong Li-Fang, Huang Jia-Yu, Sun Hao-Yang, Liu Bin-Bin, Mi Yan-Lin
College of Physics Science and Technology, Hebei University, Baoding 071002, China


† Corresponding author. E-mail: donglf@mail.hbu.edu.cn

Abstract

The influence of vibration on the spatiotemporal structure of the pattern in dielectric barrier discharge is studied for the first time. The spatiotemporal structure of the pattern investigated by an intensified charge-coupled device shows that it is an interleaving of three sublattices, whose discharge sequence is small rods–halos–large spots in each half-cycle of the applied voltage. The result of the photomultiplier indicates that the small rods are composed of moving filaments. The moving mode of the moving filaments is determined to be antisymmetric stretching vibration by analyzing a series of consecutive images taken by a high-speed video camera. The antisymmetric stretching vibration affects the distribution of wall charges and leads to the halos. Furthermore, large spots are discharged only at the centers of the squares consisting of vibrating filaments. The vibration mechanism of the vibrating filaments is dependent on the electric field of wall charges.

1. Introduction

A pattern is a typical phenomenon of nonlinear self-organization, which can be generated in many systems, such as Faraday’s systems, convection systems, two-layer coupled reaction diffusion systems, gas discharge systems, and dielectric barrier discharge (DBD) systems.[19] DBD has recently attracted widespread attention because it has produced more types of patterns[1017] due to its complex microscopic physical processes. In the DBD system, the spatiotemporal dynamics of the patterns depend on the electric field of wall charges deposited in discharge pulses. The observed patterns generally consist of several sublattices, with the next sublattices usually ignited at the center of each cell of the present sublattice.[1820] For instance, Dong’s group obtained a square superlattice pattern, where the large spots were discharged at the centers of four small spots.[21] Dong et al. observed a hexagonal superlattice pattern containing only static filaments, in which the center spots were discharged at the center of the ambient spots.[22] Here, we observed an antisymmetric stretching vibration square superlattice pattern containing both static filaments and dynamic discharge vibrating filaments, in which the large spots are discharged only at the centers of the squares consisting of vibrating filaments, rather than at the centers of the antisymmetric stretching vibration.

During recent years, more and more dynamic patterns have been discovered and studied.[23,24] Generally, the pattern consists of several sets of sublattices, and the latter sublattices are discharged at the center of the last sub-lattice. For instance, Cui et al. observed a honeycomb pattern with moving filaments, and the central spots were discharged at the centers of the hexagons formed by the moving filaments.[25] Dong’s group obtained collective vibration filaments in a hexagonal superlattice pattern, in which the large spots were discharged at the center of the vibrating hexagonal small spots.[26] Prior to this, the effect of the vibrating filaments on the spatiotemporal dynamics of the pattern was the same as that of the static filaments. Here, we have studied the influence of vibration on the spatiotemporal structure of the pattern for the first time in the DBD system. Our observations provide a new idea for the formation mechanism of vibrating filaments, and promote the in-depth study of the formation mechanism of the pattern in the DBD system.

In this paper, the influence of vibration on the spatiotemporal structure of the pattern is studied for the first time in DBD. The spatiotemporal dynamics of the antisymmetric stretching vibration square superlattice pattern (ASVSSP) is studied using an intensified charge-coupled device (ICCD) camera and a photomultiplier. The vibration mode is analyzed based on the results of the high-speed video camera (HSVC). The vibration mechanism is studied by analyzing the interaction between the wall charges of the vibrating filaments. The study of the influence of vibration on the spatiotemporal structure provides a new way to understand the formation mechanism of the pattern.

2. Experimental setup

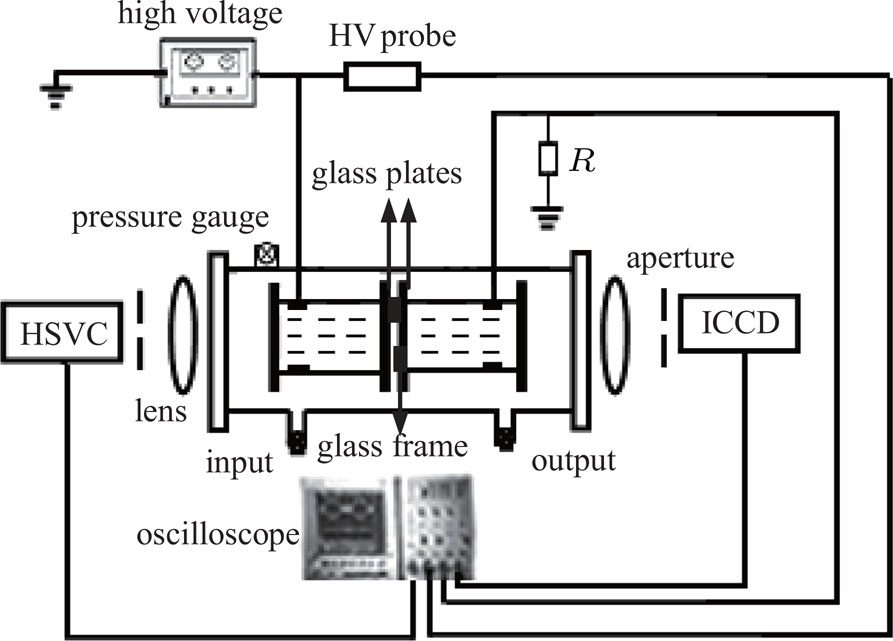
The schematic of the experimental setup is shown in Fig. 1. The experimental setup is mainly composed of a sinusoidal ac power supply, two electrodes, an ICCD, an HSVC, a photomultiplier, etc. The electrodes consists of two cylindrical containers that are sealed with 1.8 mm thick glass plates and filled with water. The specific electrodes play a significant role on the formation of the patterns. A copper ring is immersed in each container. A square glass frame 3.5 cm long and 3.6 mm thick is clamped between the two electrodes, serving as a lateral boundary. The whole cell is placed into a big cylindrical glass chamber containing a mixture gas of 75% argon and 25% air. The photomultiplier located at the end of the discharge device is used to measure the temporal correlation between different discharge substructures. The ICCD camera is used to record frames with successive discharges, but only three successive images can be obtained for each operation. The HSVC is used to explore the statistics of the vibrating behavior of the vibrating filaments.

Fig. 1. The schematic diagram of the experimental setup.
3. Results and discussion

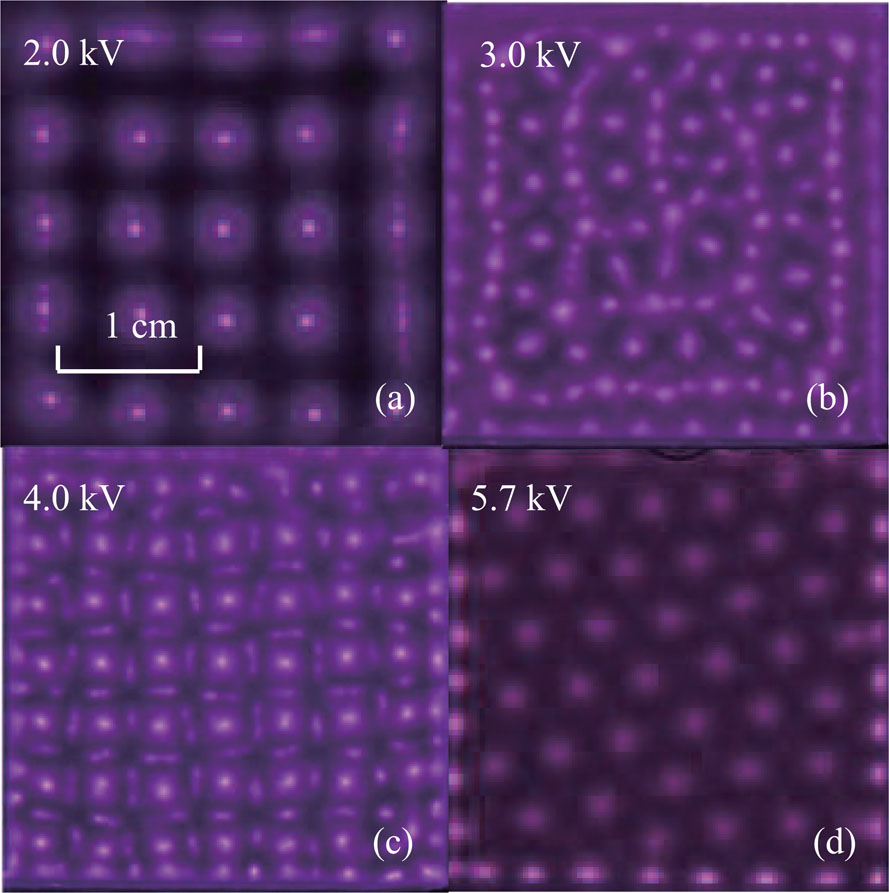
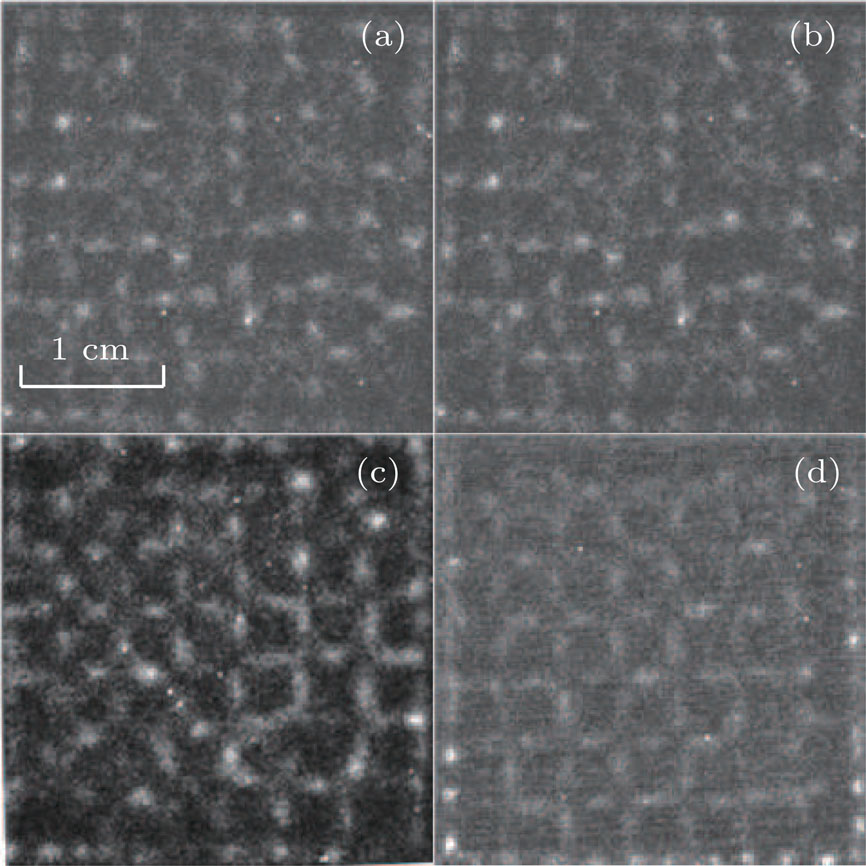
Figure 2 presents the evolution of the discharge pattern as the applied voltage increases with the following order: square pattern, chaos pattern, ASVSSP, and hexagonal pattern. When the driving voltage reaches 2.0 kV, the random filaments form a square pattern (Fig. 2(a)). As the voltage increases, these filaments forming a chaos pattern is shown in Fig. 2(b). When the voltage reaches 3.0 kV, the ASVSSP emerges (Fig. 2(c)). It can be found that the halos and large spots are discharged at the centers of the squares consisting of four small rods. Further increase in applied voltage leads to a hexagonal pattern as shown in Fig. 2(d). Other experimental parameters are as follows: gas pressure p = 0.29 kPa, argon concentration χ = 75%, driven frequency f = 56 kHz, gas gap d = 3.6 mm, and the exposure time of the picture t = 25 ms.

Fig. 2. The evolution of patterns as the voltage increases. (a) Square pattern, U = 2.0 kV. (b) Chaos, U = 3.0 kV. (c) ASVSSP, U = 4.0 kV. (d) Hexagonal superlattice pattern, U = 5.70 kV. See the text for experimental parameters.

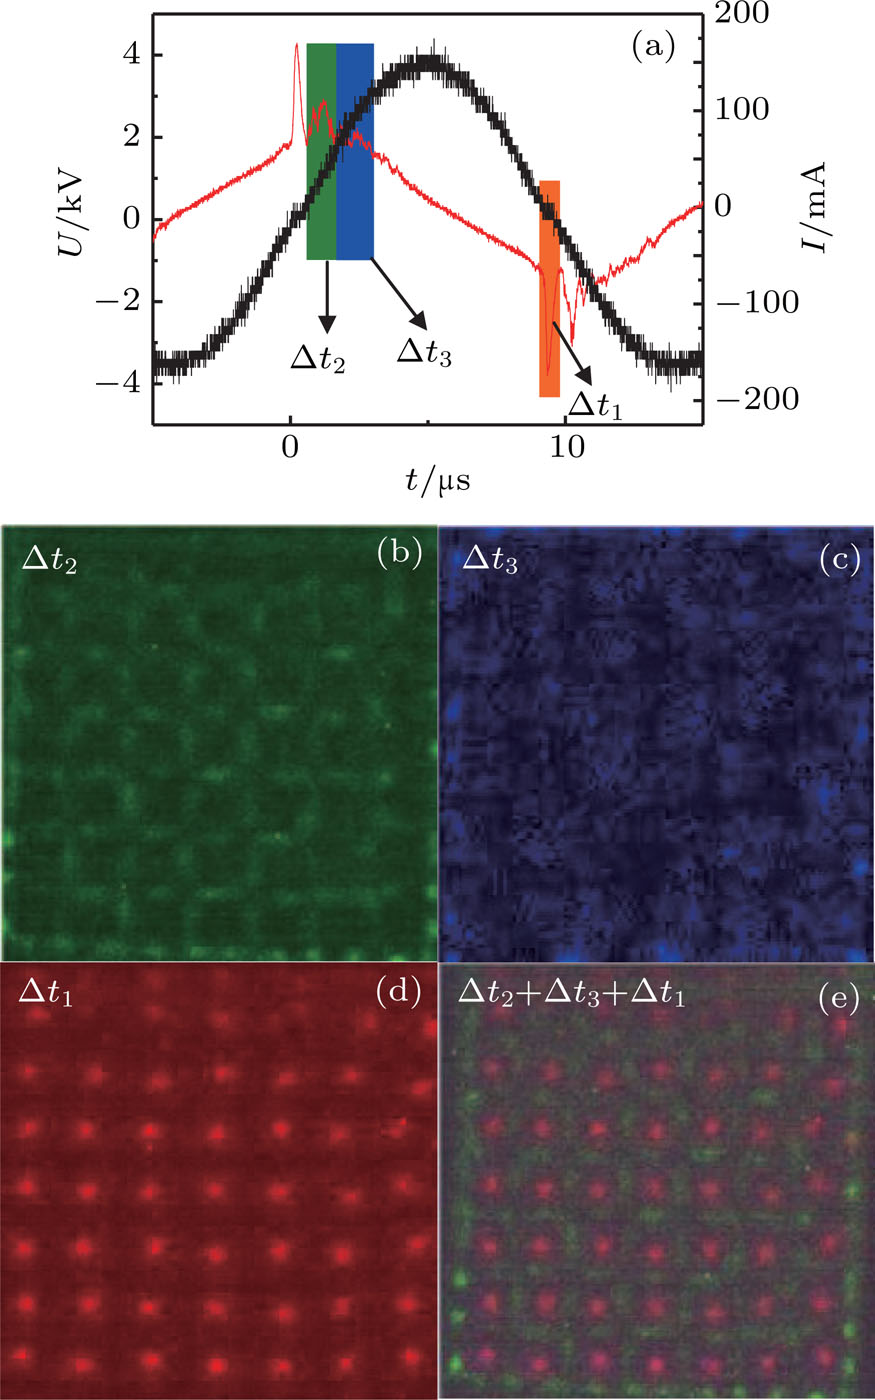
In order to investigate the spatiotemporal behavior of the ASVSSP, the time-resolved images are taken by the ICCD camera. Figure 3(a) presents the voltage and current signal of the ASVSSP. The time-resolved images with integration over 50 voltage cycles are recorded and shown in Figs. 3(b)3(d), corresponding to the three current pulses , , and , respectively. Figure 3(e) is the superposition of Figs. 3(b)3(d).

Fig. 3. Discharging sequence of the ASVSSP. (a) Waveforms of the applied voltage and current of the pattern. (b) Rods. (c) Halos. (d) Spots. Panels (b)–(d) are correlated with current pulse phases ( ns, ns, and ns) in panel (a), and integrated over 50 voltage cycles to obtain sufficient light signals. (e) The frame is the superposition of panels (b), (c), and (d).

From Figs. 3(b)3(e), it can be found that the ASVSSP is an interleaving of three different sublattices, which are small rods, large spots, and halos. Meanwhile, it can be seen that the discharge sequence of the three different substructures in each half-cycle of the applied voltage is as follows: small rods–halos–large spots.

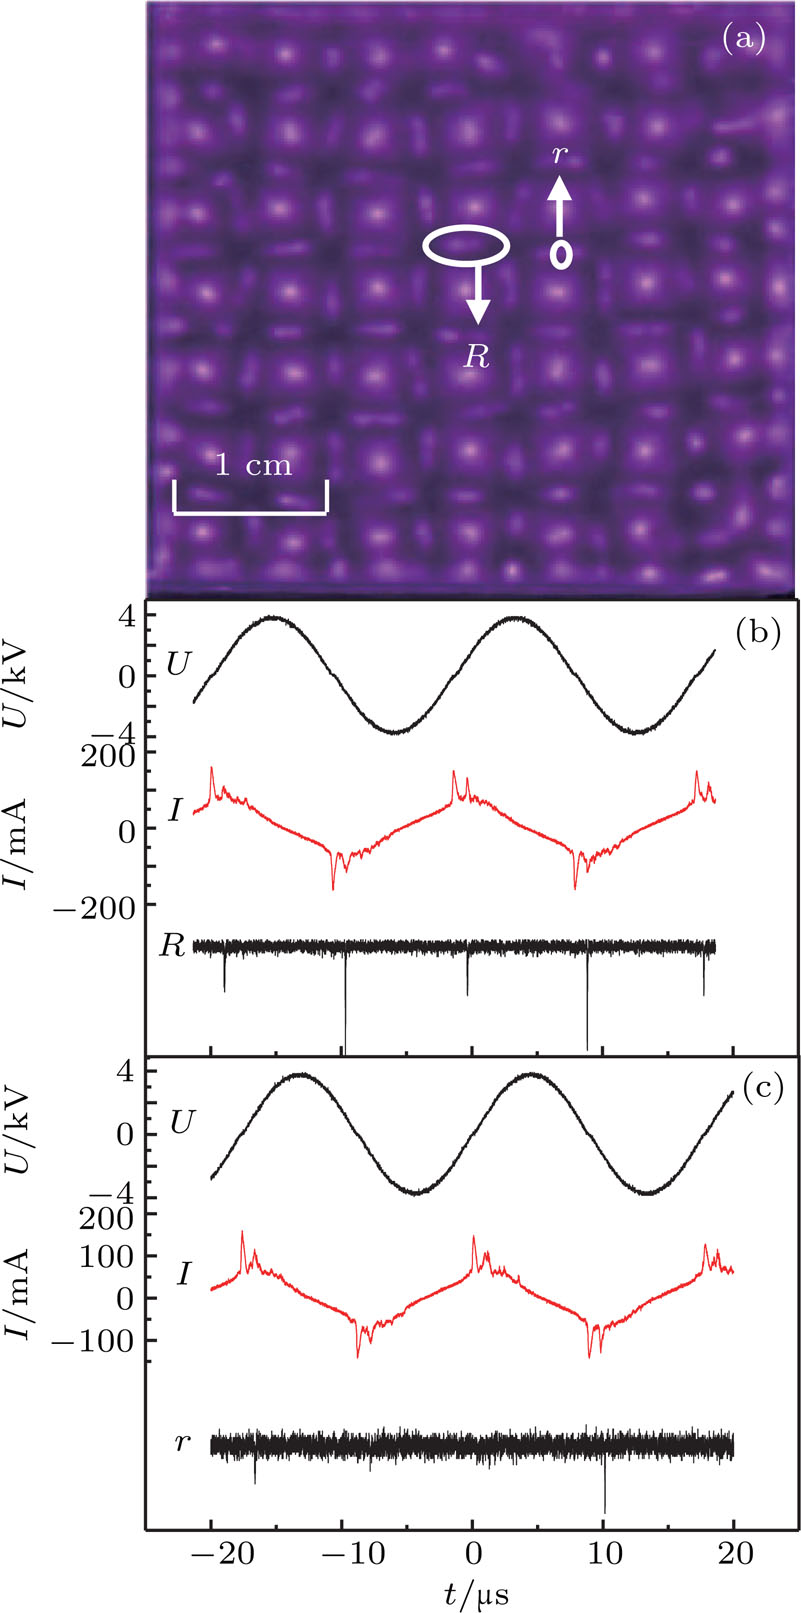
Figure 4 illustrates the light emissions of a small rod and a quarter of a small rod, where R stands for a complete rod and r stands for a quarter of a complete rod. Figure 4(b)4(c) show that the small rod is discharged in the second current pulse. From Figs. 4(b)4(c), it can be seen that the small rod has a signal at each voltage half-cycle and the quarter of a complete small rod has no signal in some applied voltage half-cycles, which indicates that the small rod is formed by a moving filament.

Fig. 4. Time correlation measurement of the ASVSSP. (a) The antisymmetric stretching vibration square superlattice pattern. (b) Time correlation measurement of a rod. (c) Time correlation measurement of only a quarter of a rod. R and r stand for a complete small rod and a quarter of a complete small rod, respectively.

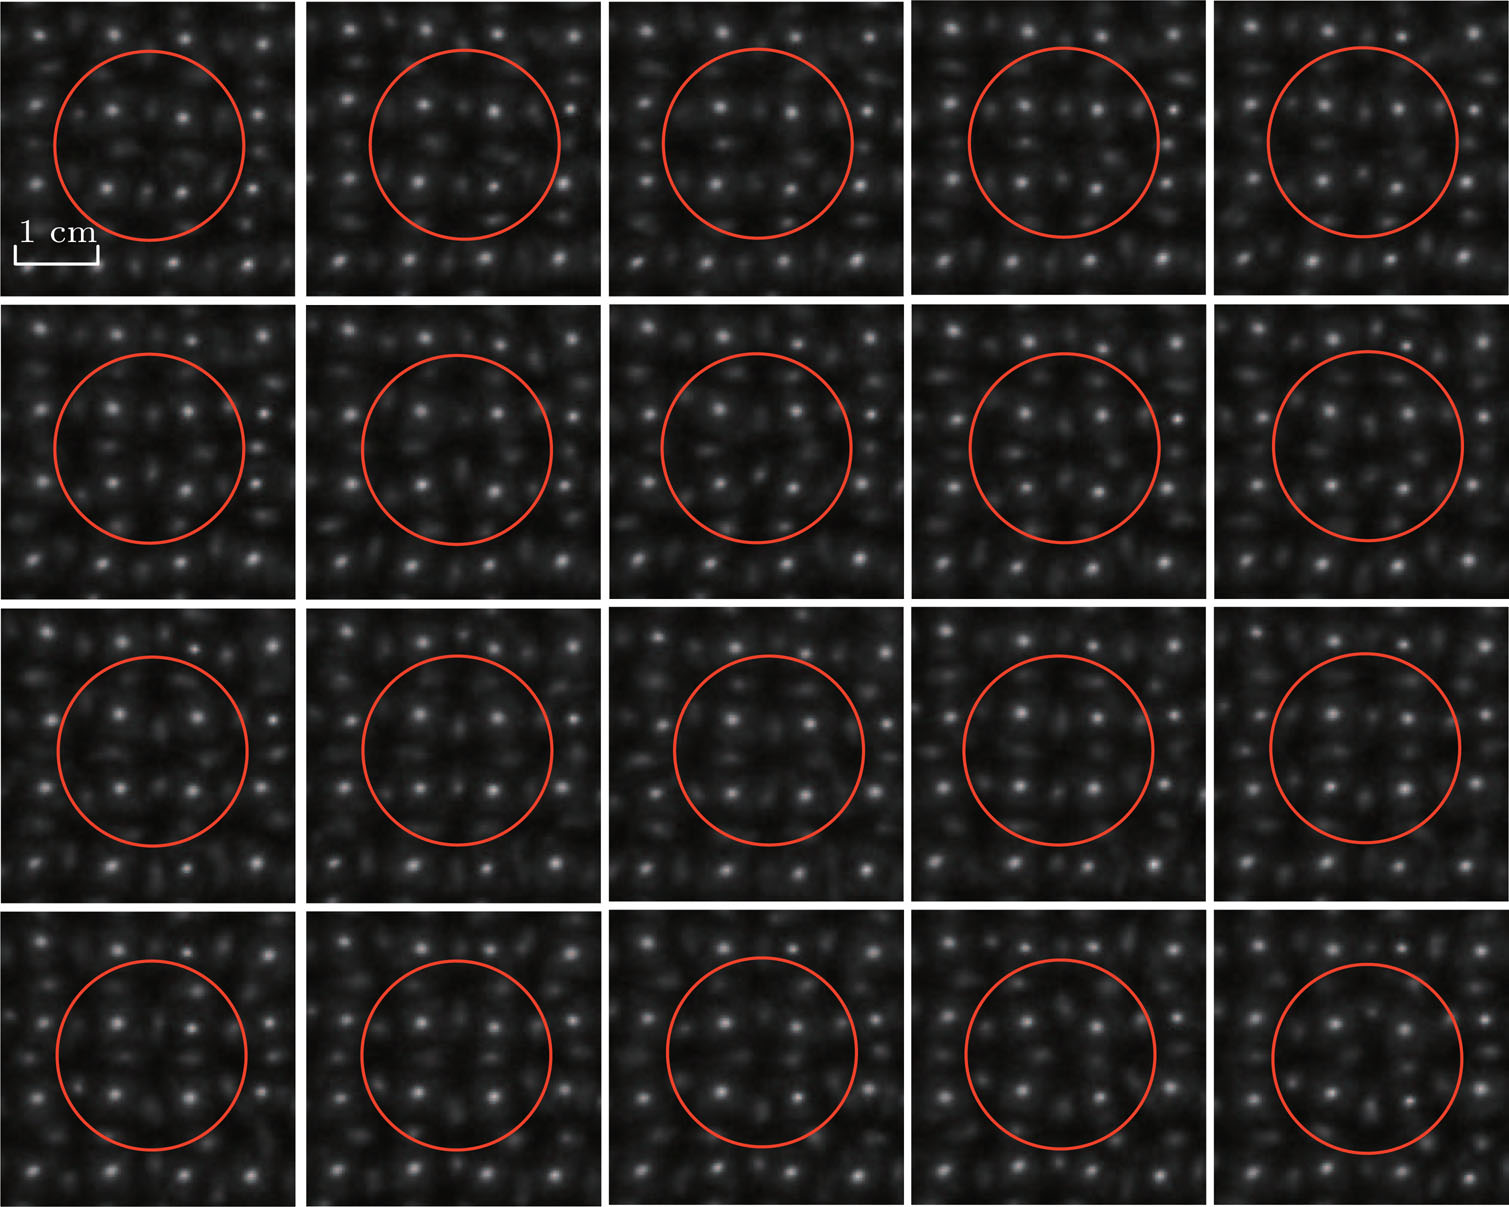
Here, to investigate the characteristic of the moving filaments, a series of consecutive frames of the ASVSSP are recorded by the HSVC with exposure, as shown in Fig. 5. By analyzing the same structural cell (marked with red circles in Fig. 5) in a series of consecutive frames, we find that the distance between two adjacent vibrating filaments in the vertical direction gradually decreases when the distance between two adjacent vibrating filaments in the horizontal direction gradually increases. It can be concluded that the moving mode of the moving filaments is antisymmetric stretching vibration, which is similar to the vibration mode of isolated particles in dust plasma.[24] It is worth pointing out that the antisymmetric stretching vibration of the vibrating filaments is a kind of collective vibration.

Fig. 5. A series of images of the ASVSSP recorded by the HSVC with exposure and delay. The two adjacent images are continuous. The red circles mark the same structural cell.

Figure 6 presents a series of images taken by the HSVC for studying the vibration period of the vibrating filaments. Figure 6(a)6(d) show the images integrated for 10 voltage cycles, 20 voltage cycles, 40 voltage cycles, and 50 voltage cycles, respectively (note that each voltage cycle is ). The t1, t2, t3, and t4 represent the time that the vibrating filaments have been continuously moving, when the voltage cycles are superimposed to 10, 20, 40, and 50, respectively. The corresponding values of t1, t2, t3, and t4 are 0.2 ms, 0.4 ms, 0.8 ms, and 1 ms, respectively. By comparing Figs. 6(a)6(d), it is found that the vibrating filaments are gradually formed with the increase in the integration cycles, and the complete small rods emerge when the image is integrated over 50 cycles. The small rods are formed when the vibrating filaments move from the maximum amplitude in the positive direction to the maximum amplitude in the opposite direction; the time that the vibrating filaments experience during this movement is half of the vibration period. From the above results, it can be found that , where T stands for the period of the vibrating filaments. Therefore, the vibration period of the vibrating filaments is 0.4 ms ms.

Fig. 6. Images of the vibrating filaments. (a)–(d) The exposed images correspond to the current pulse phases denoted by , and the images are integrated for 10 voltage cycles, 20 voltage cycles, 40 voltage cycles, and 50 voltage cycles, respectively.

In the following, the forces exerted on one vibrating filament will be analyzed to interpret the interaction between vibrating filaments. Figure 7 shows a schematic diagram of the force analysis on one vibrating filament during the movement. The forces exerted on one vibrating filament by its neighboring filaments include two large spots and six vibrating filaments. Since the large spots and the vibrating filaments are discharged at different times in a half-cycle of the applied voltage, the wall charges of the large spots and the wall charges of the vibrating filaments have different polarities. Therefore, the Coulomb forces between the vibrating filaments are mutually repulsive, and the Coulomb forces between the large spots and the vibrating filaments are mutually attractive. From Fig. 7, it can be found that the moving direction of the vibrating filament is opposite to the direction of the resultant force Fi. The resultant force Fi exerted on the vibrating filament is pointing to the direction of x, but the vibrating filament moves along the direction of −x. Therefore, the moving direction of the vibrating filament changes to moving along x when the velocity of the vibrating filament is zero. The resultant force Fi exerted on the vibrating filaments is zero when the vibrating filaments move to the equilibrium position. Since the velocity of the vibrating filament is greater than zero, the vibrating filament continues to move along the direction of x. When the vibrating filament leaves the equilibrium position, the direction of the resultant force Fi exerted on the vibrating filament is pointing to the direction of −x, which is opposite to the moving direction of the vibrating filament. Therefore, the velocity of the vibrating filament gradually decreases during this process. When the velocity of the vibrating filament is reduced to zero, the moving direction of the vibrating filament changes to moving along the direction of −x. Thus, it can be considered that the vibration mode of a single vibrating filament is a reciprocating vibration.

Fig. 7. The schematic diagram of the forces exerted on one vibrating filament, showing the force analysis of the vibrating filament when the vibrating filament leaves the equilibrium position. , , and Fi are the forces exerted by the big spot, the forces exerted by the vibrating filament, and the resultant force, respectively.

The vibration of one filament affects the force of the surrounding filaments. Therefore, four vibrating filaments are considered as a cell to study the interaction of four vibrating filaments. The structure and dynamics of vibrating filaments are determined by both the potential energy and the mutual Coulomb repulsion of the vibrating filaments. The Coulomb interaction between the vibrating filaments depends on the wall charges of the vibrating filaments during the discharge. Since the large spots are discharged at the falling edge, the remaining wall charges are extremely small after the discharge is extinguished, and therefore the influence from the large spots on the vibrating filament can be ignored. Thus, the interaction and total energy between the four vibrating filaments can be expressed as follows: Here, ri indicates the distance of the ith particle from the center of the structure, and rij is the relative distance between particles i and j (i = 1,2,3,4; j = 1,2,3,4). After calculation, there are a number of normal modes of the four particles, including the breathing mode, and the antisymmetric mode.[27] Therefore, it can be found that the formation of the antisymmetric stretching vibration of the vibrating filaments mainly depends on the interaction between the wall charges of the vibrating filaments during the discharge.

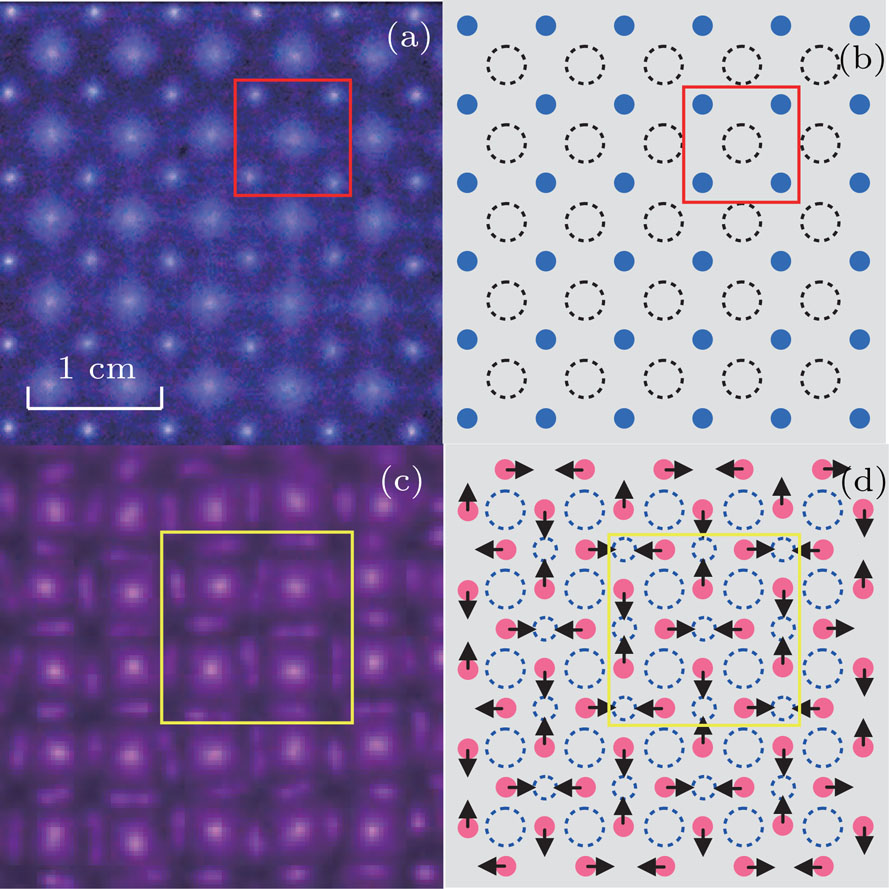
In order to study the influence of antisymmetric stretching vibration on the formation of ASVSSP, we compare the distribution of electric fields with the square superlattice pattern observed by Dong’s group.[21] Figure 8 presents a schematic diagram of the two different square superlattice patterns. Figure 8(b) and 8(d) are schematic diagrams corresponding to Figs. 8(a) and 8(c). From Fig. 8(b), it can be observed that the electric fields are formed at each center of squares consisting of four small spots. Thus, the large spots are discharged at each center of the squares consisting of four small spots. From Fig. 8(d), it can be observed that two zones with different electric field intensities are formed: one is the center of the antisymmetric stretching vibration, and the other is the center of the squares consisting of vibrating filaments. The electric field intensity at the centers of the antisymmetric stretching vibration is stronger than that at the centers of the squares consisting of vibrating filaments because the vibrating filaments are close to each other at the centers of the antisymmetric stretching vibration. Thus, the inhibition at the centers of the antisymmetric stretching vibration is also stronger than that at the centers of the square consisting of vibrating filaments. This leads to the halos being discharged at the centers of the squares consisting of four vibrating filaments rather than at the centers of the antisymmetric stretching vibration. The discharge of the halo is driven by the applied voltage, and the discharge voltage is higher than the discharge voltage of the vibrating filaments. Therefore, more wall charges will accumulate after the halo discharge is extinguished, and the amount of wall charges accumulated at the center of the halo is the largest. Since the wall charge electric field is opposite to the applied voltage electric field, the wall charge electric field will overcome the applied electric field to reach the gas breakdown threshold, which leads to the large spots discharge at the centers of the halos. Thus, the halos and large spots discharge at the centers of the squares consists of four vibrating filaments. It can be concluded that the combined influence of D4h symmetry and antisymmetric stretching vibration of the vibrating filaments leads to the formation of two electric fields with different electric field intensities.

Fig. 8. Schematic diagram of the two different square superlattice patterns after the discharge of small spots is extinguished. Panels (b) and (d) are schematic diagrams corresponding to panels (a) and (c), respectively. (b) The black areas are the centers of four small spots. (d) The large blue areas and the small blue areas represent the centers of the squares consisting of four vibrating filaments and the centers of antisymmetric stretching vibration, respectively. The arrows show the vibrations of each vibrating filament.
4. Conclusion

In conclusion, the influence of vibration on the spatiotemporal structure of the pattern is studied for the first time in DBD. The spatiotemporal dynamics of the ASVSSP is studied by an ICCD camera and a photomultiplier. The ASVSSP is an interleaving of three different sublattices. The discharge sequence of different sublattices is small rods, halos, and large spots in each half-voltage cycle, respectively. The small rods in the pattern are consisting of vibrating filaments. Based on the results of the HSVC and photomultiplier, it is concluded that the vibration mode of the vibrating filaments is a kind of antisymmetric stretching vibration. The vibration period T of the vibrating filaments with antisymmetric stretching vibration is 0.4 ms ms. The wall charge interaction between the vibrating filaments leads to the antisymmetric stretching vibration. The electric field intensity at the centers of the asymmetric stretching vibration is stronger than that at the centers of the squares consisting of vibrating filaments because the stretching vibrating filaments are close to each other at the centers of the asymmetric stretching vibration. Thus, the large spots and the halos are discharged at the centers of the squares consisting of the vibrating filaments rather than at the centers of the antisymmetric stretching vibration. This study of the antisymmetric stretching vibration square superlattice pattern enriches the our knowledge of the types of patterns and provides reference for future studies on the formation mechanism of patterns containing dynamic structures.

Reference
[1] Perinet N Juric D Tuckerman L S 2012 Phys. Rev. Lett. 109 164501
[2] Li Y R Ouyang Y Q Hu Y P 2012 Phys. Rev. 86 046323
[3] Sánchez-Álvarez J J Serre E del Arco E C Busse F H 2005 Phys. Rev. 72 036307
[4] Wu R C Zhou Y Shao Y Chen L P 2017 Physica 482 597
[5] Hecht I Kessler D A Levine H 2010 Phys. Rev. Lett. 104 158301
[6] Li X Z Bai Z G Li Y He Y F Zhao K 2015 Chin. Phys. 24 048201
[7] Liehr A W Moskalenko A S Astrov Y A Bode M Purwins H G 2004 Eur. Phys. J. 37 199
[8] Purwins H G Berkemeier J 2011 IEEE Trans. Plas. Sci. 39 2116
[9] Fu H Y Dong L F Zhao Y Liu Y 2015 J. Phys. Soc. Jpn. 84 044501
[10] Stollenwerk L 2010 Plasma Phys. Control. Fusion 52 124017
[11] Wei L Y Dong L F Fan W L Liu F C Feng J Y Pan Y Y 2018 Sci. Rep. 8 3835
[12] Bernecker B Callegari T Blanco S Fournier R Boeuf J P 2009 Eur. Phys. J. Appl. Phys. 47 22808
[13] Gurevich E L Zanin A L Moskalenko A S Purwins H G 2003 Phys. Rev. Lett. 91 154501
[14] Guikema J Miller N Niehof J Klein M Walhout M 2000 Phys. Rev. Lett. 85 3817
[15] Zhao Y Dong L F Wang Y J Fu H Y Gao Y N 2014 J. Phys. Soc. Jpn. 83 124501
[16] Fan W L Dong L F 2013 Chin. Phys. 22 014213
[17] Fan F Jia Y Liu F C He Y F 2016 Chin. Phys. 25 104702
[18] Wei L Y Dong L F Feng J Y Liu W B Fan W L Pan Y Y 2016 J. Phys. D: Appl. Phys. 49 185203
[19] Liu Y Dong L F Niu X J Gao Y N Zhang C 2015 Phys. Plasmas 22 103501
[20] Wang Y J Dong L F Liu W B He Y F Li Y H 2014 Phys. Plasmas 21 073505
[21] Dong L F Fan W L He Y F Liu F C Li S F Gao R L Wang L 2006 Phys. Rev. 73 066206
[22] Dong L F Shen Z K Li B Bai Z G 2013 Phys. Rev. 87 042914
[23] Zanin A L Gurevich E L Moskalenko A S Bödeker H U Purwins H G 2004 Phys. Rev. 70 036202
[24] Dong L F Li B Shen Z K Wang Y J Lu N 2012 Phys. Rev. 86 036211
[25] Cui Y Q Dong L F Gao X Wei L Y Liu W B Feng J Y Pan Y Y 2017 Phys. Plasmas 24 083513
[26] Dong L F Shang J He Y F Bai Z G Liu L Fan W L 2012 Phys. Rev. 85 066403
[27] Melzer A Klindworth M Piel A 2001 Phys. Rev. Lett. 87 115002