Dramatic change of the self-diffusions of colloidal ellipsoids by hydrodynamic interactions in narrow channels
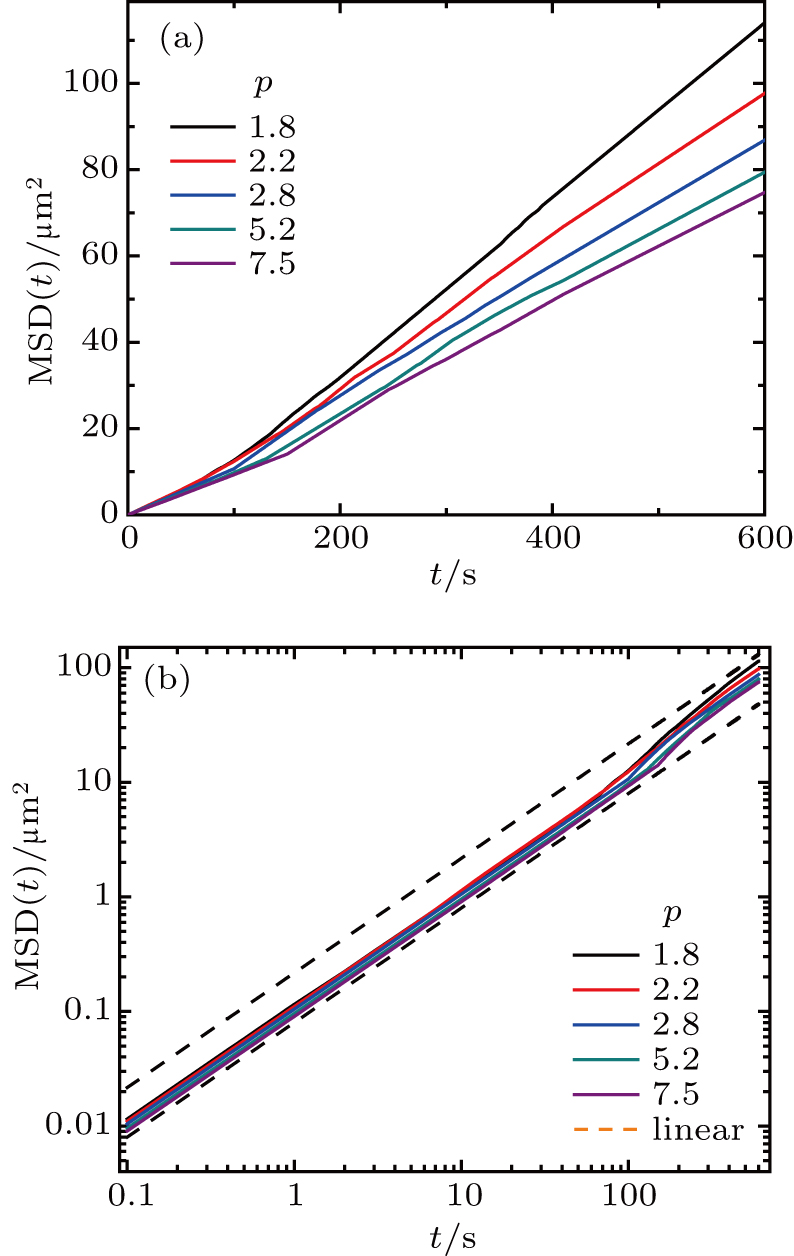
(a) MSDs along the x-direction. (b) Log–log plot of panel (a). Line colors correspond to various p values.

Dramatic change of the self-diffusions of colloidal ellipsoids by hydrodynamic interactions in narrow channels |
|
(a) MSDs along the x-direction. (b) Log–log plot of panel (a). Line colors correspond to various p values. |
 |