|
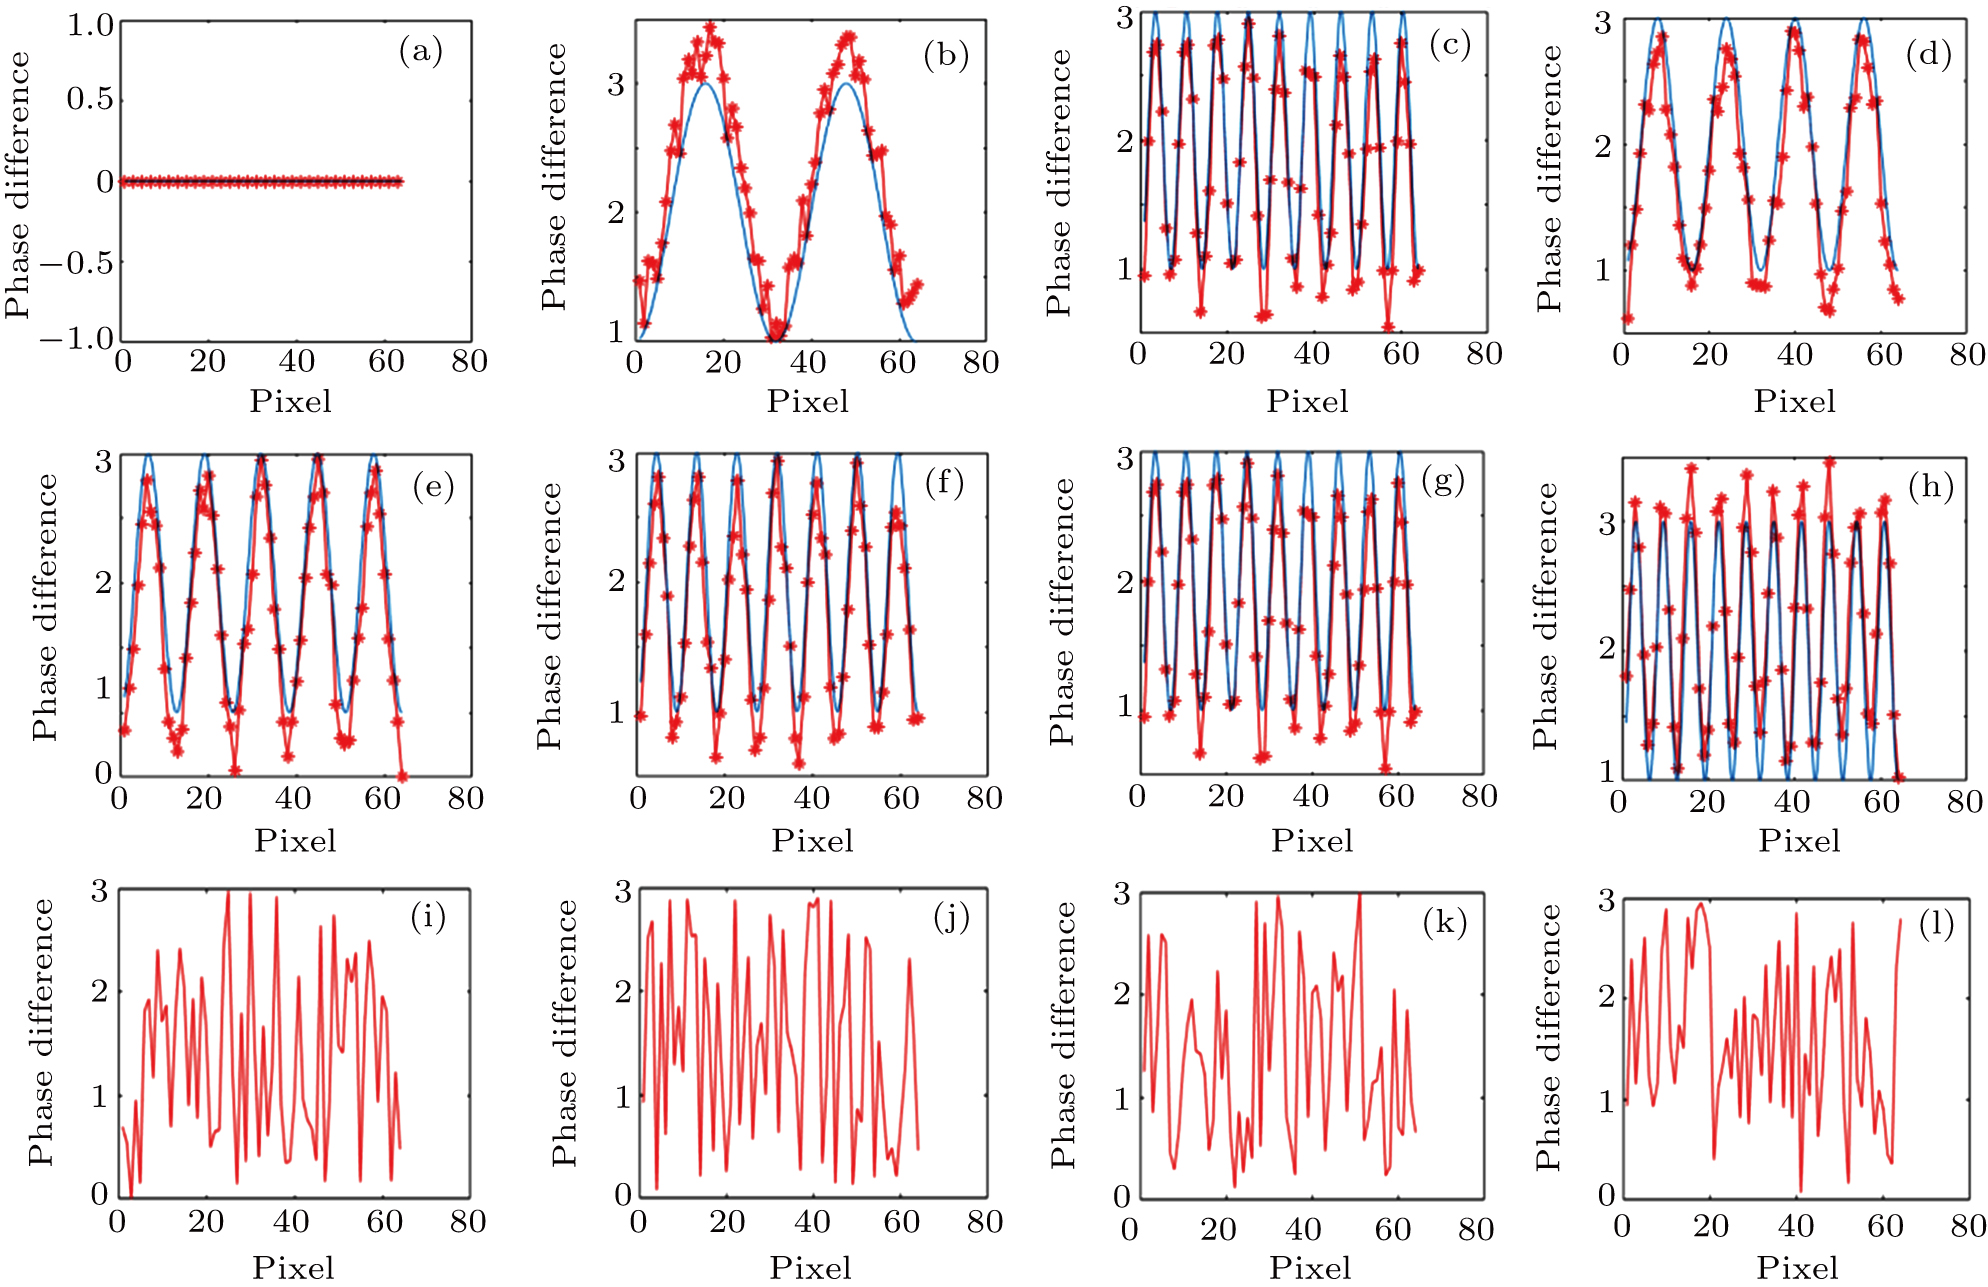
The phase difference profiles along one direction of Fig. 7. The independently controlled number of segments of the spatial light modulator is 64 × 64 = 4096. In (a)–(h), the number of peaks is 0, 2, 2, 4, 4, 5, 7, 9, and 9, respectively. Note that there are many saw-tooth structures in the plots. The asterisks denote the smoothed experimental phase differences, while the blue curves denote the observed phase gradient patterns. In (i)–(j), the phase masks of the focal points move by
16
×
24
μ
m
,
17
×
24
μ
m
,
18
×
24
μ
m
, and
19
×
24
μ
m
, respectively, and the curves show the phase pattern profiles of the moved focal points minus the original focal point.
|