|
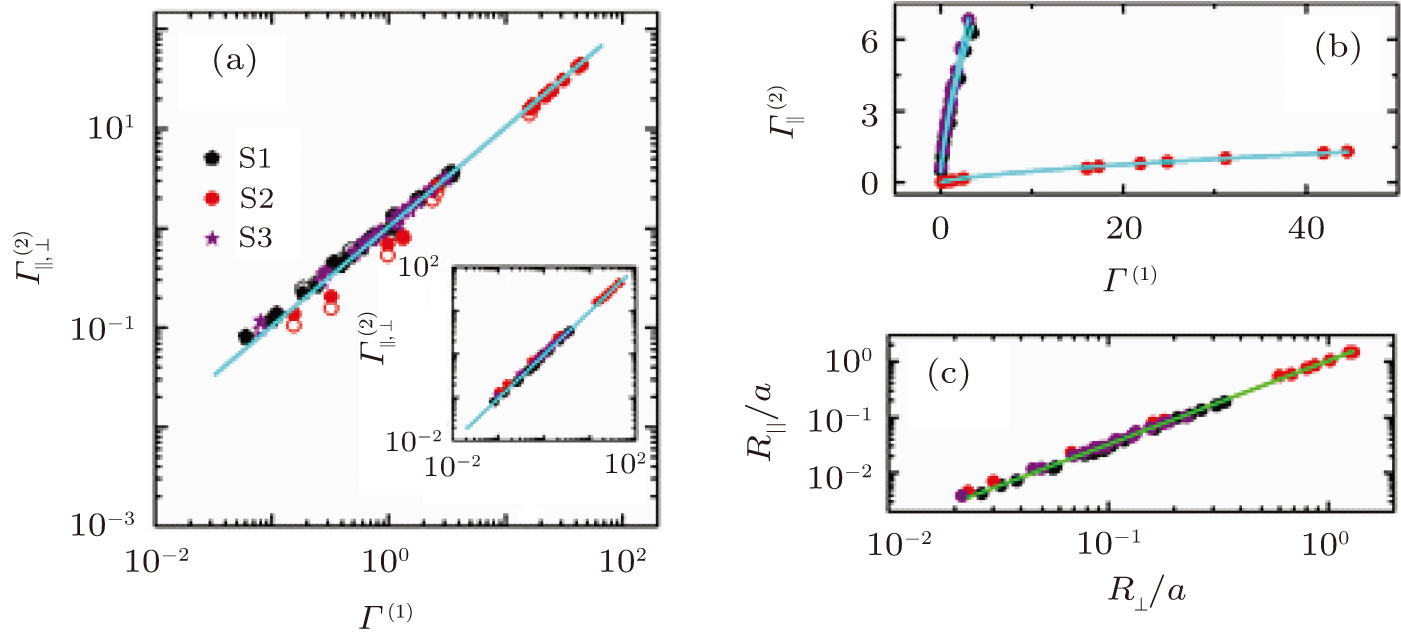
(a) Comparison between the friction coefficients
Γ
(
1
)
calculated from
D
′
s
(
n
)
and the friction coefficients
Γ
∥
,
⊥
(
2
)
of the three samples S1 (black pentagon), S2 (red dot), and S3 (purple star) on a log–log plot. The solid dots correspond to
Γ
∥
(
2
)
, and the open dots correspond to
Γ
⊥
(
2
)
. The cyan line is the guide for the eye, where the slope of the line is 1.0. In the inset, a comparison is shown between the friction coefficients
Γ
∥
(
2
)
and
Γ
⊥
(
2
)
on a log–log plot. The cyan line is the guide for the eye, where the slope of the line is 1.0. (b) The friction coefficient
Γ
⊥
(
2
)
obtained from
R
⊥
=
λ
s
follows a power-law relationship with the friction coefficient
Γ
(
1
)
for the three samples. The cyan lines represent fits of the form
Γ
⊥
(
2
)
∼
(
Γ
(
1
)
)
2
/
3
. (c) Relationship between the characteristic lengths
R
∥
and
R
⊥
scaled by the particle radius a for the three samples on a log–log plot. The green line is the fit to
R
∥
/
a
=
(
R
⊥
/
a
)
3
/
2
.
|

