|
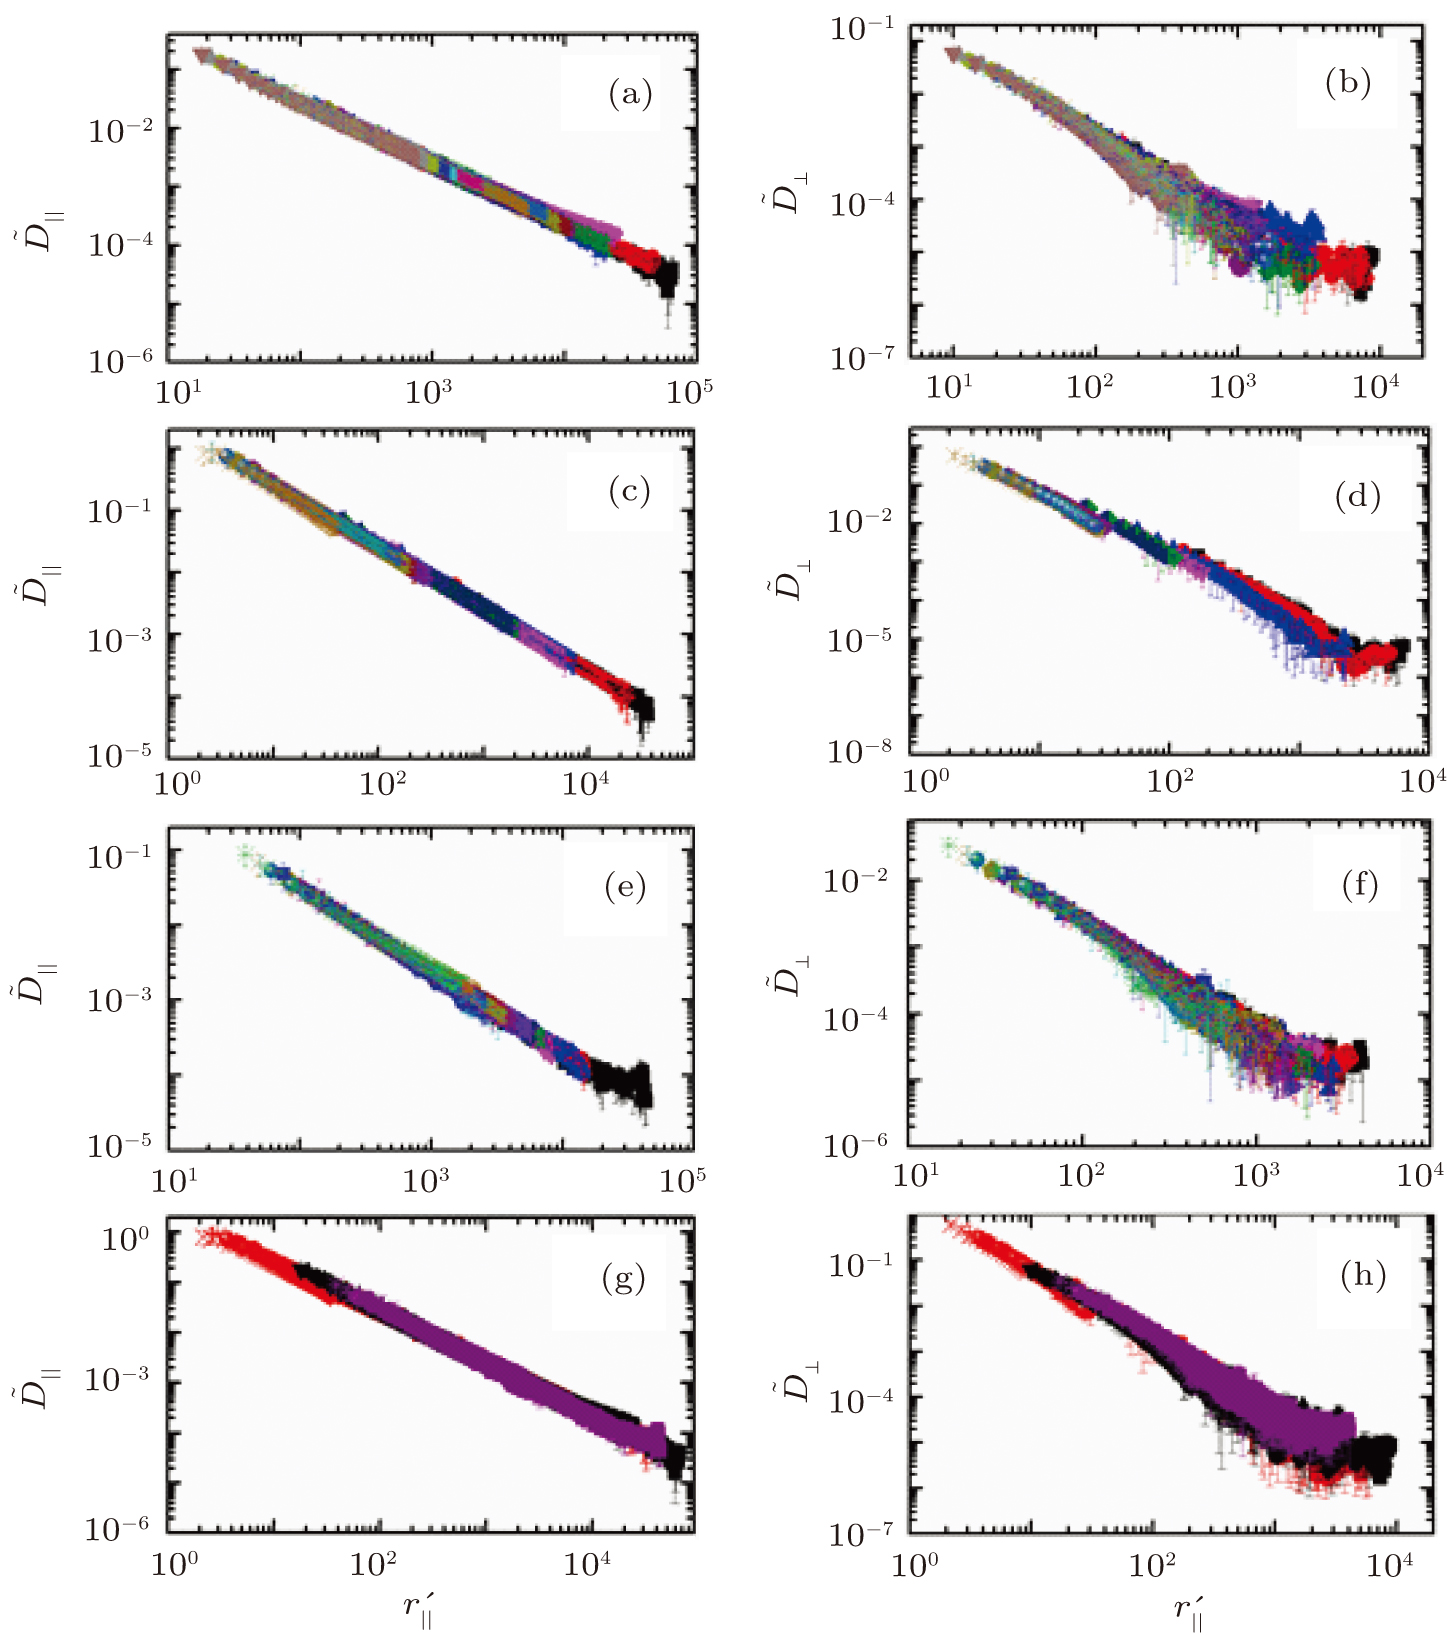
Scaled correlated diffusion coefficient
D
∼
∥
as a function of the scaled distance
r
′
∥
for samples S1 (a), S2 (c), S3 (e). Scaled correlated diffusion coefficient
D
∼
⊥
as a function of the scaled distance
r
′
⊥
for samples S1 (b), S2 (d), S3 (f). The differently colored symbols represent different values of n. The concentration n ranges from 0.007 to 0.2 for S1 [panels (a) and (b)], from 0.02 to 0.62 for S2 [panels (c) and (d)], from 0.005 to 0.18 for S3 [panels (e) and (f)]. The comparison of three master curves
D
∼
∥
(
r
′
∥
)
(g) and
D
∼
⊥
(
r
′
⊥
)
(h) for all samples: S1 (black), S2 (red), and S3 (purple). The symbols used in panels (a) and (b) are the same as those in Fig. 2. The symbols used in panels (c) and (d) are the same as those in Fig. A1 in the appendix. The symbols used in panels (e) and (f) are the same as those in Fig. A2 in the appendix.
|