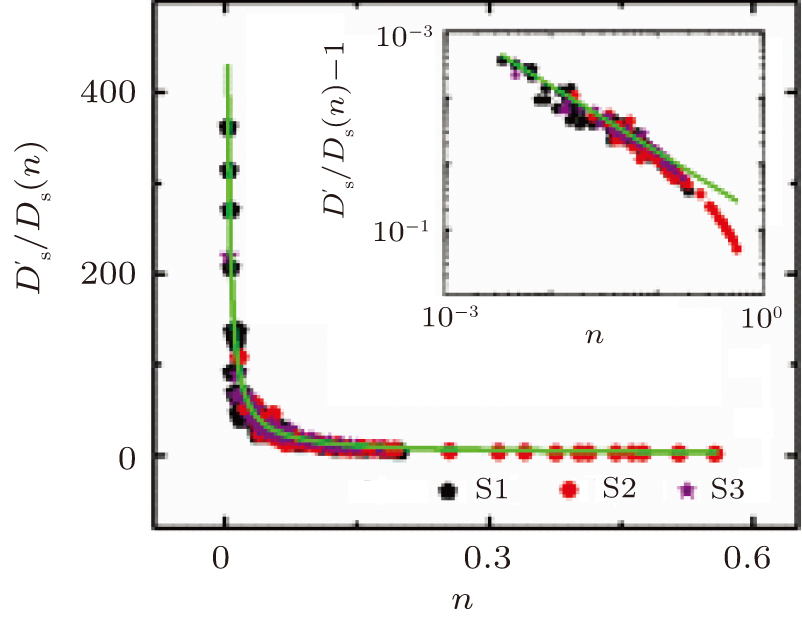
Relationship between characteristic lengths and effective Saffman length in colloidal monolayers near a water–oil interface
The calculated

Relationship between characteristic lengths and effective Saffman length in colloidal monolayers near a water–oil interface |
|
The calculated |
 |