Relationship between characteristic lengths and effective Saffman length in colloidal monolayers near a water–oil interface
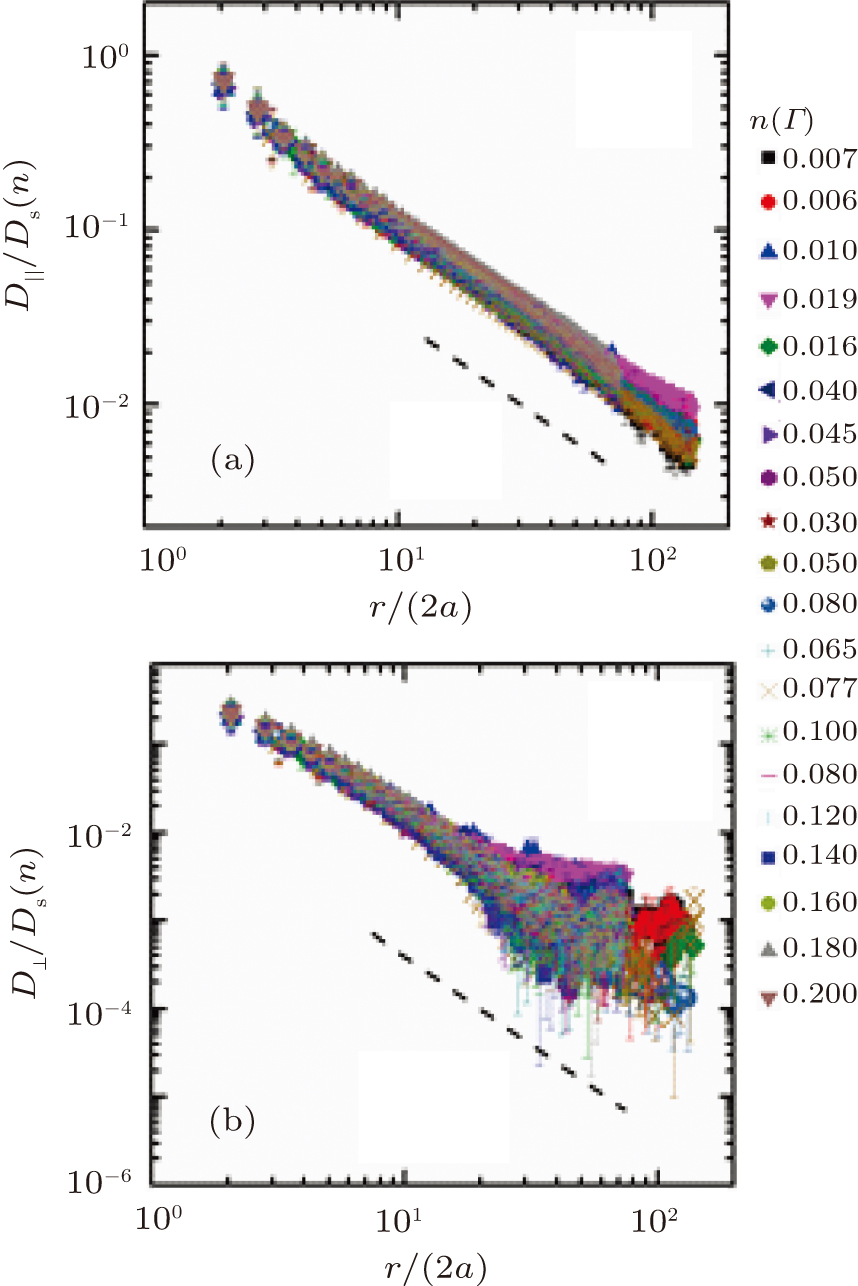
Measured correlated diffusion coefficients

Relationship between characteristic lengths and effective Saffman length in colloidal monolayers near a water–oil interface |
|
Measured correlated diffusion coefficients |
 |