Digitally calibrated broadband dual-comb gases absorption spectral measurements
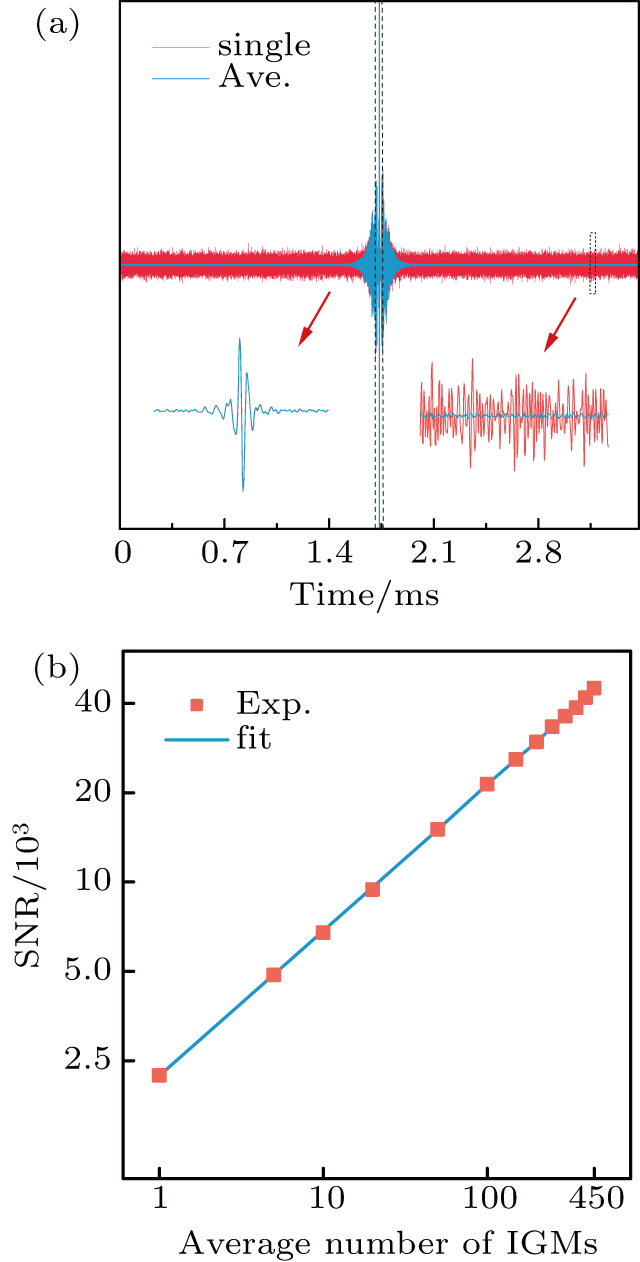
(a) IGMs in the time domain. Single IGM after calibration (in red) and an averaged one of 460 consecutive calibrated IGMs (in blue). The bursts (left) and the interference data away from the center (right) are shown in the zoomed parts. (b) The time domain SNR of the calibrated IGMs with different co-adding numbers.