The c-axis complex permittivity and electrical impedance in BaFe2As2: Experimental examination on transformation validity
Li Yongqiang1, Du Xinzhe2, Gong Dongliang3, Yang Qirui2, Zhang Wenliang3, Xie Tao3, Feng Bo2, Chen Kai2, ‡, Luo Huiqian3, Liu Junming1, §, Zhu Jinsong1
National Laboratory of Solid State Microstructures, Nanjing University, Nanjing 210093, China
School of Science, Nanjing University of Science and Technology, Nanjing 210094, China
Beijing National Laboratory for Condensed Matter Physics, Institute of Physics, Chinese Academy of Sciences, Beijing 100190, China


† Corresponding author. E-mail: kai@njust.edu.cn liujm@nju.edu.cn

Abstract
Abstract

Complex permittivity and electrical impedance have been measured along the c-axis in single crystals BaFe2As2, which are the conductors known as the parent compound of 122-type iron superconductor. The resultant relative errors defined in the study indicate the existence of the transformation between complex permittivity and electrical impedance in the conductors, and these two physics quantities possibly reveal different aspects of the consistent superconductivity-relevant physics picture.

1. Introduction

Transformation among physics quantities is an important basis to describe inherent relevance and consistency among different physics processes. For example, the present transformation between complex permittivity and electrical impedance (Eq. (1)) dictates the effect of equivalence between charge migration and electrical dipole reorientation in insulators. In other words, charges migrate in a short range to reorient local electrical dipoles, and then possibly, in a long range even through the bulk, to pin at material-electrode interfaces, as measured as capacitance that is encountered when forming an AC electric field. We, in fact, agree that all migrating charges are as displacement current for bulk polarization, and this is the reason why the bulk conductivity is included in the imaginary part of the complex permittivity (Eq. (1)). More specifically, in the very simple case of a linear, homogeneous, isotropic insulator, the transformation is simplified in the form of scalar rather than second rank tensor, as follows:[1] with where is the complex permittivity, is the real part of the complex permittivity, is the imaginary part of the complex permittivity, , σ is the bulk conductivity, ω is the angular frequency, and , f is the frequency of the applied AC voltage, C0 is the vacuum capacitance, is the electrical impedance, R is the resistance, and X is the reactance, in most cases, , , R, and X are functions of f. The transformation shows that, besides of their modulation on the bulk polarization, the short- or long-range migrating charges may produce the inductance effect, while the long-range ones definitely contribute to the bulk conductivity or the resistance. The transformation is valid in insulators, such as CaCu3Ti4O12.[2,3] However, in the case that there are no local dipoles in conductors, the question arises of what role the migrating charges play, and the transformation validity may be questioned. The investigation into the transformation validity, to some extent, makes us reinspect these physics quantities as the parameter, and highlight the physics difference in the two processes, to describe the phenomena as accurately as possible. Preceded from experiments, it may further outline the limitation of measuring accuracy, and show us the need for improvement of measurement specification, method, and instrument.

As one parent compound of iron-based superconductors, single crystals of BaFe2As2 could be used as an investigated example. Only on the a- or b-axis do the tetragonal-to-orthorhombic structural transition at temperature and the antiferromagnetic phase transition below nearly the same temperature K take an effect, and, therefore, the c-axis electrical property is independent of the a- or b-axis ones, and the complex permittivity and electrical impedance could be simplified as a scalar, and the electrical measurement on c-axis is only required perpendicular to the ab plane. In this study, we examine the transformation validity between complex permittivity and electrical impedance in c-axis of single crystal BaFe2As2.

2. Experiments

High-quality single crystals of BaFe2As2 were grown by the self-flux method that has been reported elsewhere.[4] By using a diamond wire cutting machine, all of the single crystals were cut into plates with the dimensions of 2.8 mm × 2.8 mm × 0.28 mm. Silver conductive paints (186-3600, RS components, UK) were painted on both surfaces of the specimens and two gold wires were welded and then dried by infrared light in the air, making two electrodes and two external wires, respectively. The room-temperature measurement on both complex permittivity and electrical impedance was obtained by using a Hewlett-Packard impedance/grain-phase analyzer, model 4294A (HPIGPA, Agilent Co., USA) and the room-temperature standard sample stage. The minimum measured value of impedance is 3 mΩ, with the basic impedance accuracy ±0.08%, the work frequency range is from 40 Hz to 110 MHz with 1 mHz resolution. A sinusoidal voltage with peak voltage of 200 mV from 100 Hz to 1 MHz was applied, and the peak voltage was selected to guarantee that both the complex permittivity and electrical impedance were measured within the range of precision. To confirm the data reliability, we utilized the sample stage of a physical property measurement system (PPMS, Quantum Design Co. USA). After the specimen measurements were finished, the silver electrodes, gold wires, and other components were directly connected to the instrument, their complex permittivity and electrical impedance values were measured and subtracted as background data.

3. Results and discussion

Using the parallel plate capacitor method with the dielectric mode (parallel capacitor) CpD and the impedance mode RX, we directly obtain the capacitance of the single crystals
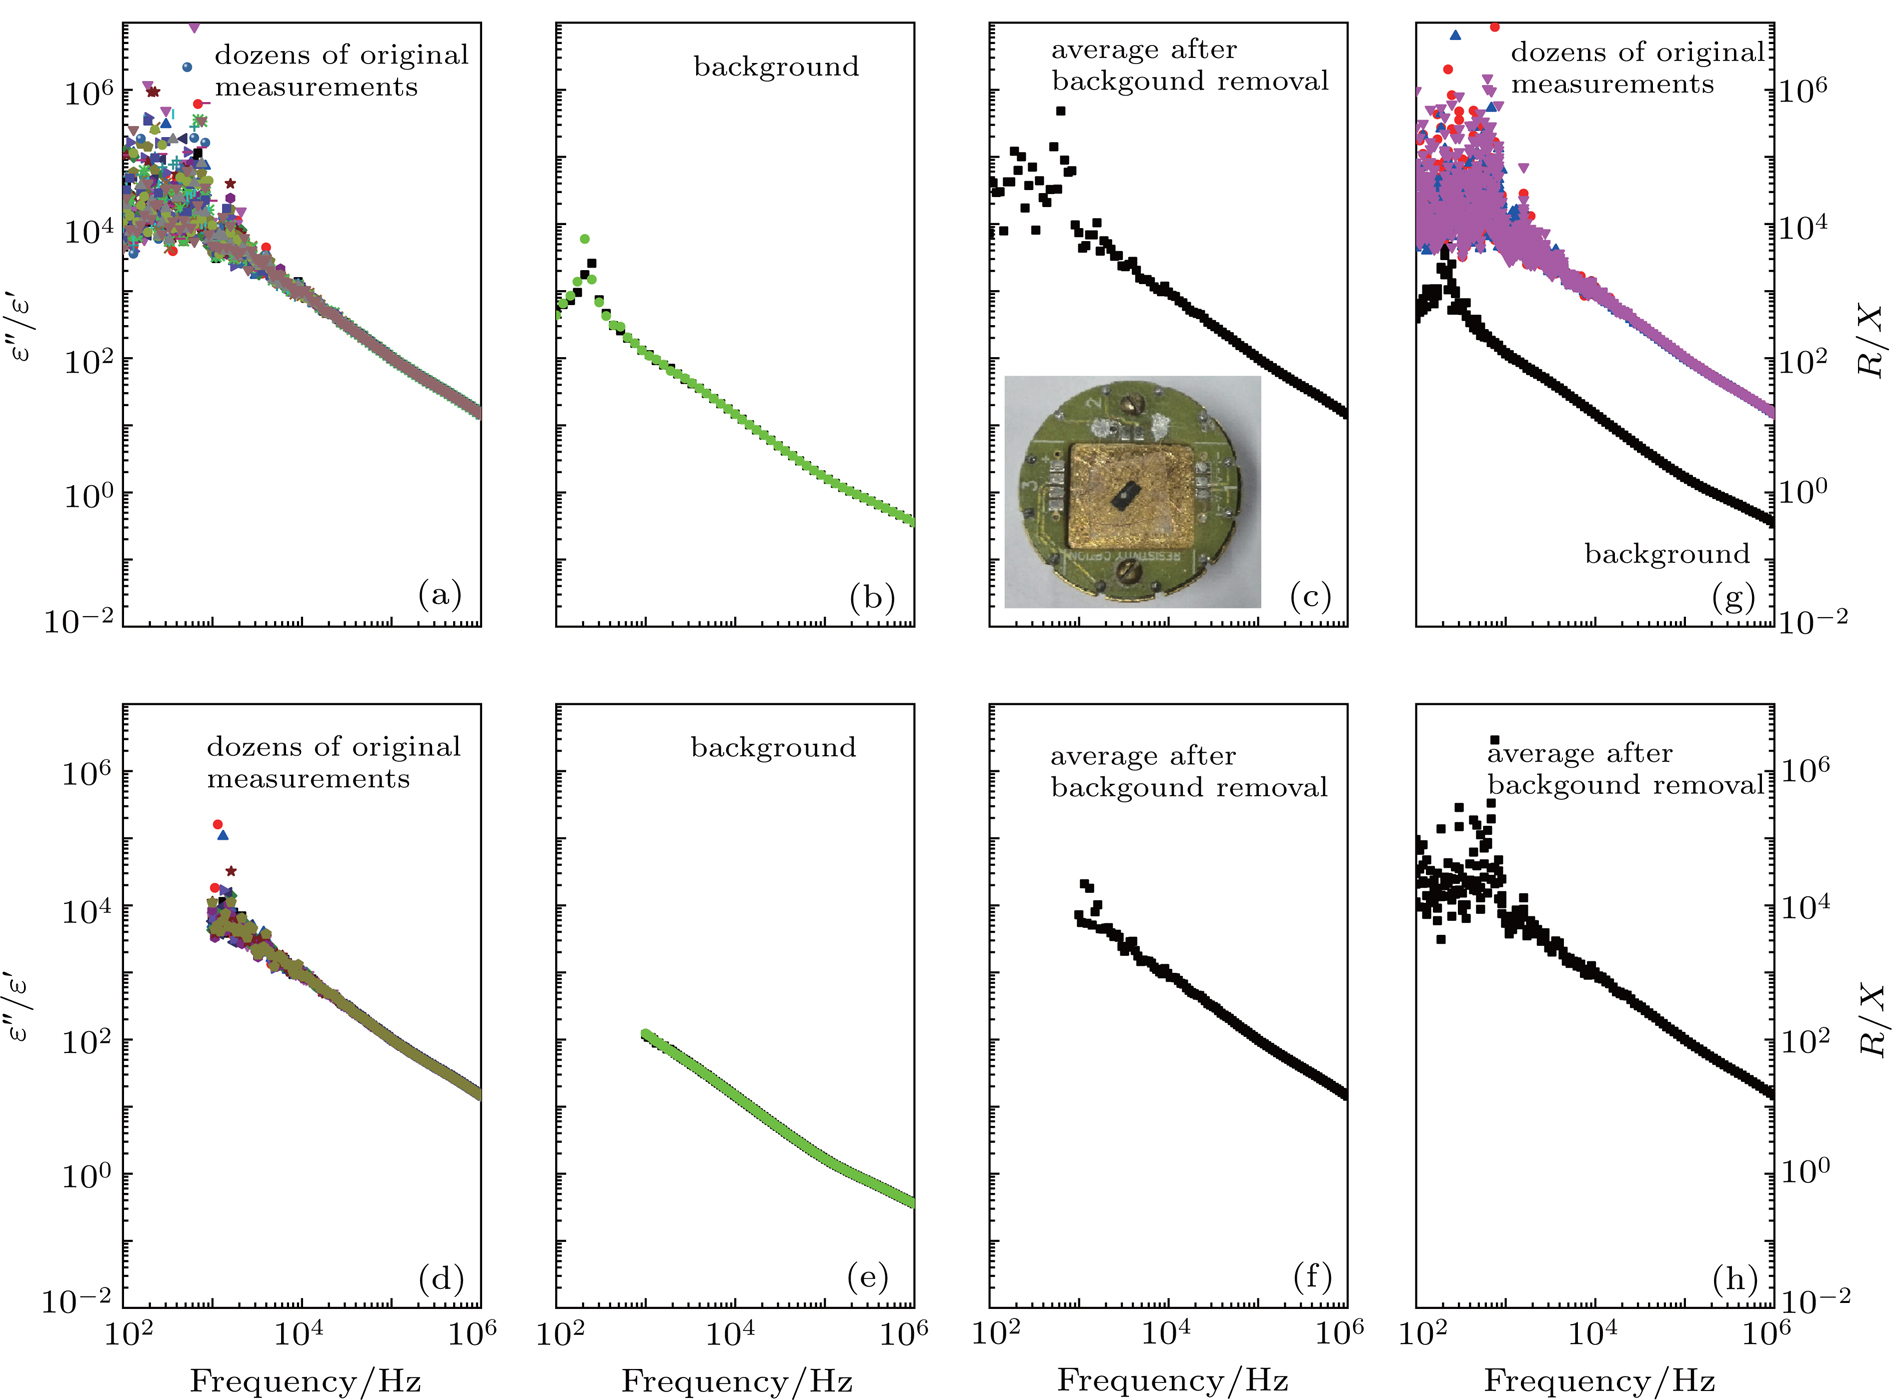
 , the dielectric loss , R, and X, respectively, where is the vacuum dielectric constant, S is the electrode area, and d is the thickness of the measured single crystals. Based on the previous work, we can distinguish the values of , , R, and X in the c axis from those in the a and b axes. We can easily derive the following relation from Eq. (2): The examination of the transformation validity is simplified to compare the values of with those of R/X. Both and R are the numerator of the fraction, and their positional symmetry indicates that the loss caused by the long-range charge migration is the origin of resistance. The positional symmetry of and X as the denominator attenuates that the short-range charge migration modulates the local dipoles, and simultaneously, triggers the oscillation of the local dipoles for building up an inherent magnetic field to resist the change of the charge migration.

Figure 1 shows the measured values of and R/X by using the standard sample stage of HPIGPA at room temperature. Below Hz, both the original values of and R/X are randomly dispersive, which is due to the interference of environmental electrical signals or noises. However, the values show a certain degree of repeatability above 105 Hz. The average data of and R/X, as shown in Figs. 1(b) and 1(d), show the same variation tendency as the original values do (Figs. 1(a) and 1(c)).

Fig. 1. Dozens of original measurements of (a) , (c) R/X, and (b), (d) their average data. The inset in panel (b) shows the standard sample stage of the HPIGPA.

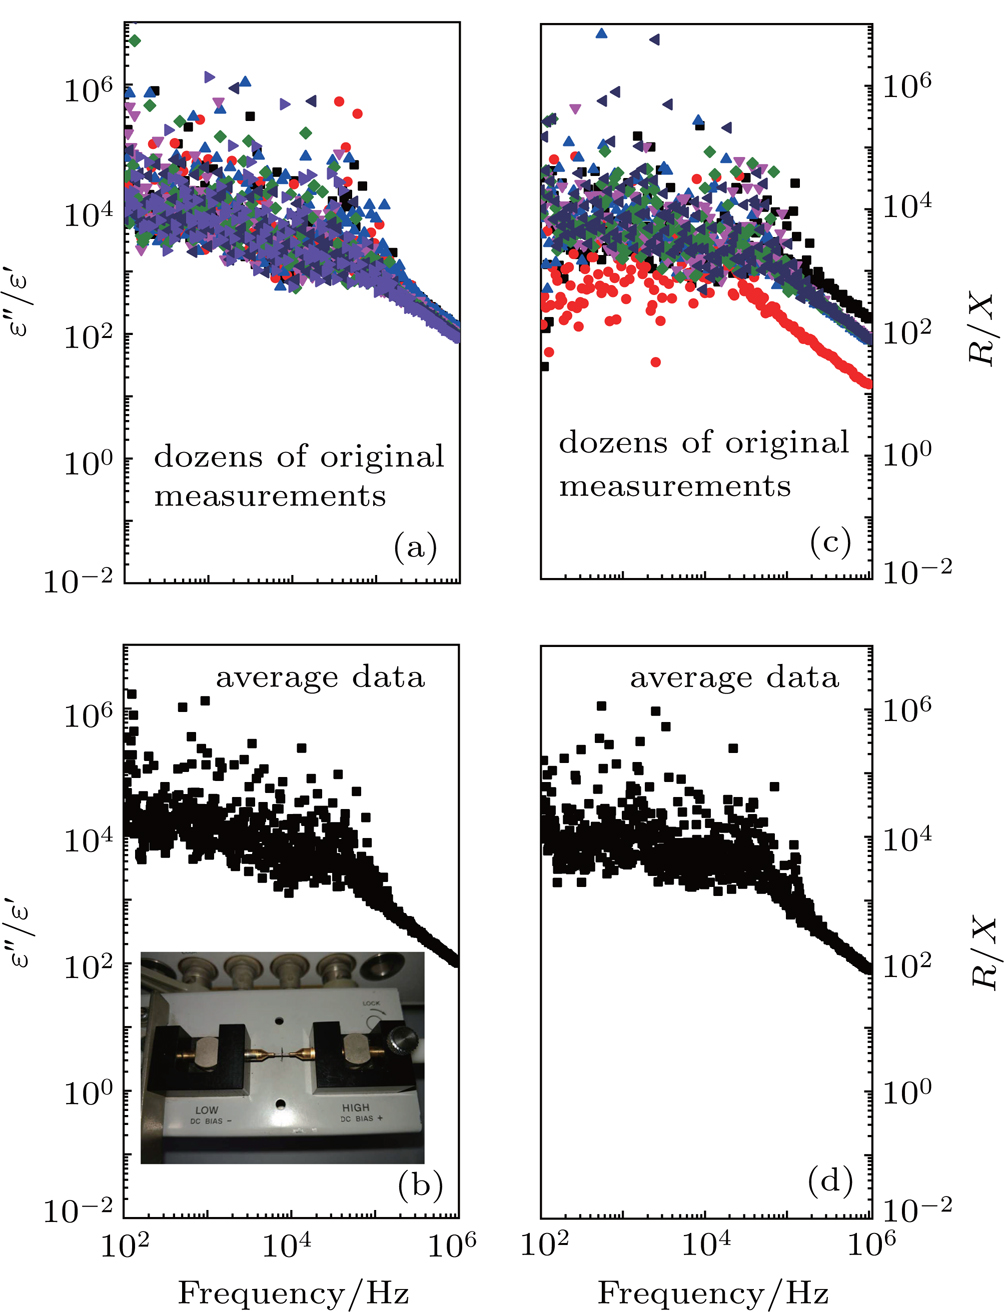
To evaluate the effect of the standard sample stage, we used another sample test stand in PPMS (the inset in Fig. 2(c)) and the measured data are shown in Fig. 2. As shown in Fig. 2(a), dozens of measurements show that the original values of are not dispersive above Hz and the repeatability is good, and the case is similar for the background values. Using the data of dozens of measurements and the background data (Figs. 2(a) and 2(b)), we subtract the values of the single crystal as shown in Fig. 2(c). In the measured frequency range, the values are far larger than 1, and these single crystals are good conductors which are consistent with the previous results. For confirming the value repeatability above 104 Hz, we changed the minimum measured frequency from 102 Hz to 103 Hz, as shown in Fig. 1(d). Without doubt, the values of above 104 Hz are reliable. Therefore, we cautiously use the values of from 104 Hz to 106 Hz to compare the values of R/X in the same frequency range, while we attribute the value dispersion below 104 Hz to the interference from other unshielded signals. Similar dispersion is also found in the values of R/X below 104 Hz, as shown in Figs. 2(g) and 2(h). The average data, after background removal, show the same magnitude range from 10−2 to 106 as those of do, and their frequency dependence is similar, which indicates the existence of the transformation validity.

Fig. 2. Dozens of original measurements, background, and the average data after background removal of from 102 Hz to 106 Hz ((a)–(c)) and from 103 Hz to 106 Hz ((d)–(f)), respectively. (g) and (h) The same for R/X, respectively. The inset in panel (c) shows the sample stage of the PPMS.

To quantitatively examine the transformation validity, we define the relative errors or which seem physically equivalent. We use the average date of the experiments in the standard sample stage of the HPIGPA above 105 Hz (Figs. 1(b) and 1(d)), and the average data after background removal in the sample stage of the PPMS above 104 Hz, to calculate the relative errors and the results are shown in Fig. 3. The relative errors of the data measured in the standard sample stage of HPIGPA show the poor repetition, and are even in the range from 10−1 to 103. However, those in the sample stage of PPMS show better results as small as ∼0.1% , and indicate the existence of the transformation validity. Hence, we can tell the difference in measurement accuracy between the standard sample stage of HPIGPA and the sample stage of PPMS, and there is the possibility to improve it.

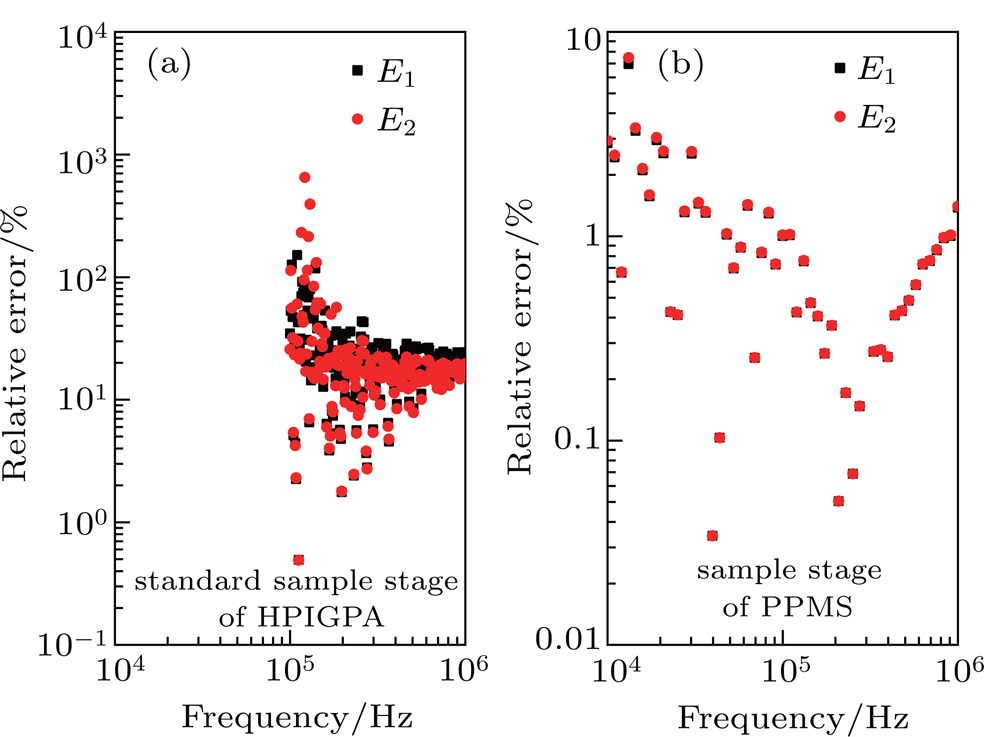
Fig. 3. Relative errors E1 and E2 of the data measured in (a) the standard sample stage of the HPIGPA and (b) the sample stage of the PPMS, respectively.
4. Conclusion

In summary, complex permittivity and electrical impedance are measured along c-axis of single crystals BaFe2As2, which are conductors, by using the same equipment with two different sample stages. The transformation between the complex permittivity and electrical impedance in the conductor is tried to be validated. Although there is an indication of the transformation validity, the improvement on the measuring accuracy should be done for the experimental evidence.

Reference
[1] Jonscher A 1983 Dielectric Relaxation in Solids London Chelsea Dielectrics Press https://b-ok.cc/book/3108854/4ffbcf
[2] Li W Schwartz R 2007 Phys. Rev. 75 012104
[3] Guo Y Y Guo Y J Wei T Liu J M 2015 Chin. Phys. 24 127701
[4] Chen Y Lu X Wang M Luo H Q Li S L 2011 Supercond Sci. Technol. 24 065004