Structure instability-induced high dielectric properties in [001]-oriented 0.68Pb(Mg1/3Nb2/3)O3–0.33PbTiO3 crystals
Li Xiao-Juan1, 2, †, Fan Xing1, Xi Zeng-Zhe1, Liu Peng2, Long Wei1, Fang Pin-Yang1, Nan Rui-Hua1
Shaanxi Key Laboratory of Photoelectric Functional Materials and Devices, School of Materials and Chemical Engineering, Xi’an Technological University, Xi’an 710021, China
School of Physics and Information Technology, Shaanxi Normal University, Xi’an 710119, China


† Corresponding author. E-mail: lixiaojuan28@163.com

Abstract
Abstract

The structure evolution and origin of ultrahigh dielectric properties have been investigated in the low temperature range from 300 K to 5 K for [001]-oriented 0.68Pb(Mg1/3Nb2/3)O3–0.33PbTiO3 (PMN–33PT) crystal. The experimental results reveal that a short-range ordered monoclinic MA is the dominant phase at ambient temperature. As the temperature drops below 270 K, the MA transforms into monoclinic MC, and the MC remains stable until 5 K. Although no phase transition occurs from 5 K to 245 K, polar nanoregions (PNRs) display visible changes. The instability of PNRs is suggested as responsible for the low temperature relaxation. The ultrahigh dielectric constant at room temperature is associated with the instability of local structure and phase transition. Our research provides an insight into the design of high-performance ferroelectric materials.

1. Introduction

Relaxor ferroelectric single crystals Pb(Mg1/3Nb2/3)O3–PbTiO3 (PMN–PT) with morphotropic phase boundary (MPB) are attracting considerable attention because of their outstanding piezoelectric, dielectric, and electromechanical properties. At present, it is universally considered that the polar nanoregions (PNRs) play a key role for the ultrahigh electrical properties in relaxor-PT ferroelectric crystals,[13] and a large number of studies have been carried out. For example, Xu et al.[4] found a strong interaction between PNRs and acoustic phonons using the neutron inelastic scattering method. They speculated that the phase fluctuation induced by PNRs should be responsible for the ultrahigh piezoelectric properties. Recently, Li et al.[5] reported the high electrical properties of relaxor-PT crystals result from the presence of PNRs. Moreover, they achieved an ultrahigh piezoelectric constant (d33 = 1500 pC/N) and dielectric constant ( ) in PMN–PT ceramic by introducing local structural heterogeneity, i.e., PNR.[6] Based on first-principles, Tan et al.[7] reported that the dielectric relaxor of PMN–PT crystals depend on local structures associated with the average B-site cation displacement. Harby et al.[8] even found the dielectric relaxation induced by polar nano-regions in xBaTiO3–(10−x)PbTiO3–60V2O5–30B2O3 glass systems. Although great interest has been focused on the polar nano-regions or local structures, direct experimental evidence is still insufficient on how the PNRs dynamic variation affects piezoelectric/dielectric properties of relaxor-PT crystals, especially at cryogenic temperatures, which is critical to understand the effect of PNRs on macroscopic properties.

The investigations into the thermodynamics of PNRs were mainly focused on above room temperature for relaxor-PT systems.[913] In contrast, limited studies have been reported below room temperature. Yang et al.[14] reported that the monoclinic MC transforms into monoclinic MA as the temperature decreases to 188 K, and the phase transition temperature exhibits remarkable dependence on the inhomogeneity of PNRs. Although the synchrotron x-ray and neutron diffraction results showed that the long-range MC phase in PMN–PT crystals with MPB remains stable in the temperature range from room temperature to 20 K,[15,16] thermal fluctuation in nanoscale was still proposed, and strongly affected the properties of PMN–PT crystals.[1,46]

The crystal structure from the synchrotron x-ray and neutron diffraction is considered to be an average structure. The local structure of PNRs is usually different from the average lattice structure of the compound. In addition, the phase-field simulations are only a theory analysis, and it will be perfect if the experimental results are in agreement with that of the theory. Micro-Raman spectrometer is a useful method to investigate the PNRs.[14,17,18] In this work, cryogenic experiments involving confocal micro-Raman spectrometer and dielectric response have been performed in low temperature range from 5 K to 300 K for nominal composition [001]-oriented 0.68Pb(Mg1/3Nb2/3)O3–0.33PbTiO3 (PMN–33PT) crystals. Our aim is to supply direct experimental evidence to demonstrate the thermodynamics of PNR and its effect on lattice and macroscopic properties, which is very useful for understanding the relationship between local structural heterogeneity and outstanding electrical properties in relaxor-PT crystals.

2. Experimental

The 0.68Pb(Mg1/3Nb2/3)O3–0.33PbTiO3 relaxor ferroelectric single crystals were grown using the Bridgman method. The (001)-cut sample with dimensions 3 × 3 × 0.5 mm3 was prepared. The sample was polished and annealed to remove possible residual stresses. The x-ray diffraction (XRD, XRD-6000, Shimadzu Corporation, Japan) was used to certify the orientation of the sample. Then, Ag was sputtered on the (001) and (00 ) surfaces as electrodes. The dielectric properties above room temperature were measured by a precision LCR meter (Agilent E4980A, Santa Rosa, USA), while the dielectric properties in the temperature range from 300 K to 5 K were measured using a CFM-9T-H3-IVTI-25 model dielectric analyzer meter (Cryogenic Ltd, London). The piezoelectric coefficient and PE loop were measured using a quasi-static ZJ-6A d33 meter (Institute of Acoustics, Chinese Academy of Sciences) and a ferroelectric test system (Precision Premier II, Radiant Technologies), respectively.

Raman spectra were collected on the (001)-face of the crystal using a confocal micro-Raman spectrometer (Horiba/Jobin Yvon HR800). A solid state laser of 532 nm wavelength was used as the excitation source. The polarization direction of the incident light was parallel to the y-direction. The spectra were recorded in the parallel (VV) and crossed (VH) polarization configurations, respectively. The sample was placed inside a cryostat cell, and the temperature was changed from 305 K to 5 K.

3. Results and discussion

The composition fluctuation in the as-grown PMN–PT crystals by Bridgman technique is inescapable. The PNRs are very sensitive to the composition and orientation. Figure 1(a) and 1(b) show the dielectric spectra of the sample above room temperature, and the XRD pattern is seen in the inset of Fig. 1(a). Only (100) and (200) crystal indices are observed, indicating the single (100) face. Two dielectric constant peaks at 316 K and 423 K, corresponding to ferroelectric–ferroelectric and ferroelectric–paraelectric phase transformations, respectively, are observed in Fig. 1(a). Based on the formula of crystal composition and Curie temperature, we can obtain[19] where x is defined as the content of PT, and TC (°C) is Curie temperature. The calculated x is about 0.33, indicating the PMN–33PT crystal composition. The modified phase diagram suggests that the PMN–0.33PT crystal is monoclinic (M) phase at room temperature.[15] As the temperature increases, the M firstly transforms into tetragonal (T) at 316 K, and then the T enters into Cubic (C) at 423 K. One can see that two loss abnormalities around 300 K and 313 K are detected in dielectric loss, as shown in Fig. 1(b). According to previous reports,[12,20] the two loss abnormalities may be assigned to the at 300 K, and at 313 K, respectively. These relaxation characteristics imply that the [001]-oriented PMN–33PT might be coexistence of the MA and MC phases at room temperature.[11,12]

Fig. 1. The dielectric spectra of a sample in the temperature range from 290 K to 570 K: (a) dielectric constant, and (b) dielectric loss. The XRD pattern is shown in the inset of panel (a).

Figure 2(a) and 2(b) illustrate the response of relative dielectric constant and dielectric loss in low temperature range from 5 K to 300 K for the [001]-oriented PMN–33PT crystal. In Fig. 2(a), two dielectric constant peaks corresponding to 100 K (peak I) and 280 K (peak II) are observed. The broadened phase transition and strong frequency dispersion, especially for the peak I, indicate the relaxation characteristic related to the PNRs. The dielectric constant increases sharply from 5 K to 240 K, and the increment ( ) accounts for 60% of the room-temperature dielectric constant ( ). In Fig. 2(b), two dielectric loss peaks at and are observed, which is identical to the previous reports.[13,21] Reference [13] suggested that the loss peak at 270 K was related to water vapor, while structural irregularity was proposed in [21]. Our results seem to support the latter because our sample was not exposed directly in liquid helium. A significant dielectric loss peak is seen at , and it is almost independent of frequency below 50 K, but it shows a strong dependence on the temperature. As the temperature rises above Tml, the temperature dependence of dielectric loss decreases, but the frequency dispersion increases. Previous studies indicated that this type of dielectric relaxation is associated with high dynamic of PNRs.[1,5,6,21]

Fig. 2. Temperature dependence of dielectric response for [001]-oriented PMN–33PT crystal in the temperature range of 5 K to 300 K: (a) dielectric constant, and (b) dielectric loss.

To demonstrate the existence of PNRs, the relationship between the temperature Tml and frequency f, corresponding to the dielectric loss peaks near Tml, has been investigated based on the Arrhenius law[1] where f is frequency, Ea is activation energy, Tml is the temperature at which the dielectric loss obtains maximum, kB is the Boltzmann constant, and f0 is pre-exponential factor. Based on the Arrhenius law, the Ea=0.155 eV is extracted. This value is similar to the switching energy barrier of the PNRs in PMN crystals,[22] indicating the presence of PNRs at Tml. It was reported that the freezing temperature of PMN–PT crystal is approximately 45 K.[21] Neutron spin echo measurements have shown that the PNRs display entirely static below freezing temperatures, but they gradually become relaxationally thermal dynamic on heating.[4] Thus, we deduce that the dielectric relaxation near Tml is attributed to the thermal dynamics of PNRs.

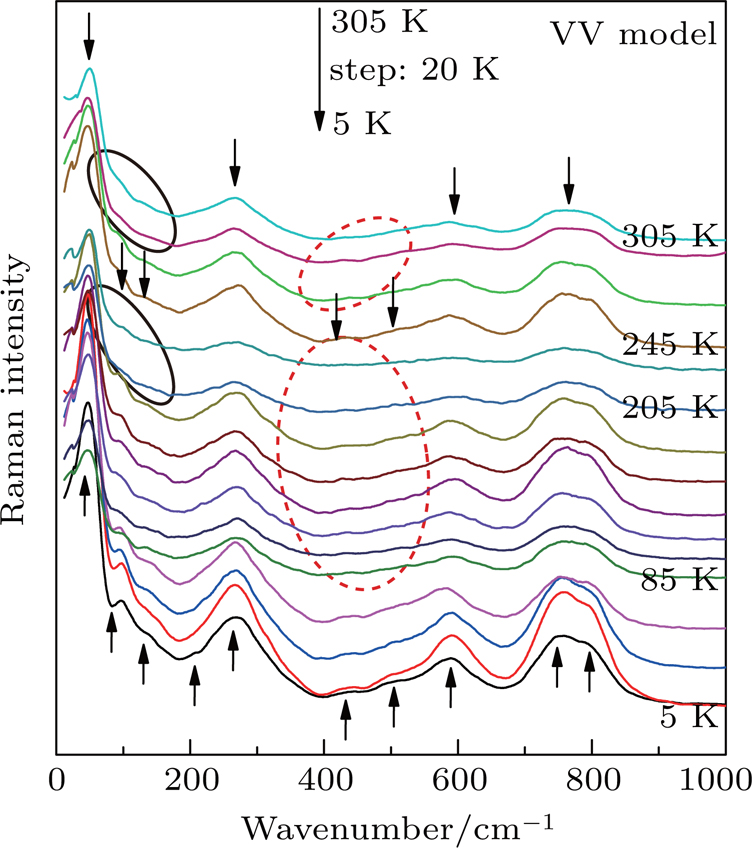
Figure 3 shows the polarization micro-Raman spectra with VV mode as a function of temperature from 305 K to 5 K for [001]-oriented PMN–33PT single crystal to study thermal dynamics of PNRs and lattice. The Raman spectra show a significant dependence on temperature. Compared with the high temperature, Raman bands are narrower, and the intensity of Raman peaks is larger in low temperature range from 5 K to 45 K. This result indicates that the change of local structure occurs near 45 K, which leads to variation of dielectric properties, as shown in Fig. 2. Ten Raman peaks, around frequencies of 50 cm−1, 95 cm−1, 136 cm−1, 204 cm−1, 270 cm−1, 432 cm−1, 505 cm−1, 586 cm−1, 749 cm−1, and 790 cm−1 marked by the black arrows, are observed at low temperature. However, only four Raman peaks centered around 50 cm−1, 270 cm−1, 580 cm−1, and 780 cm−1 are presented at high temperature. One can notice that five modes located at 95 cm−1, 136 cm−1, 204 cm−1, 430 cm−1, and 505 cm−1 at low temperature almost disappear at high temperature indicated by ellipses with red dotted and black solid lines. All phenomena reveal that there are lattice and/or PNRs thermal dynamics in the temperature range from 5 K to 305 K.[5,21,23]

Fig. 3. Raman spectra of [001]-oriented PMN–33PT crystal at different temperatures from 305 K to 5 K.

It is well known that the lattice symmetry determines the number of Raman active modes, which can be used to detect the phase transitions in solids. Based on the group theory, the rhombohedral R lattice symmetry has seven Raman modes, the tetragonal T has eight, and the monoclinic M or orthorhombic O has twelve.[24] Figure 4(a)4(c) show the deconvolution of multiple Lorentzian peaks for [001]-oriented PMN–33PT crystal at specific temperatures. In Figs. 4(a) and 4(b), twelve Raman active modes are observed, indicating the M or O structures at 25 K and 205 K. Yang et al.[17] excluded the O structure by analyzing the intensity of Raman mode as a function of rotation angle θ in [001]-oriented PMN–33PT crystal, and their result is in agreement with previous studies.[912] Therefore, the crystal structure should be the M in our work at 25 K and 205 K. However, only ten Raman active modes instead of 12 are observed at 305 K, as shown in Fig. 4(c). Marssi et al.[25] suggested that the discrepancy of mode numbers between the experiment and theory analysis in PMN–PT compound can be attributed to the existence of the PNRs arising from the complex B-site substitution in relaxor ferroelectrics.

Fig. 4. The deconvolution of multiple Lorentzian peaks for [001]-oriented PMN–33PT crystal at specific temperatures.

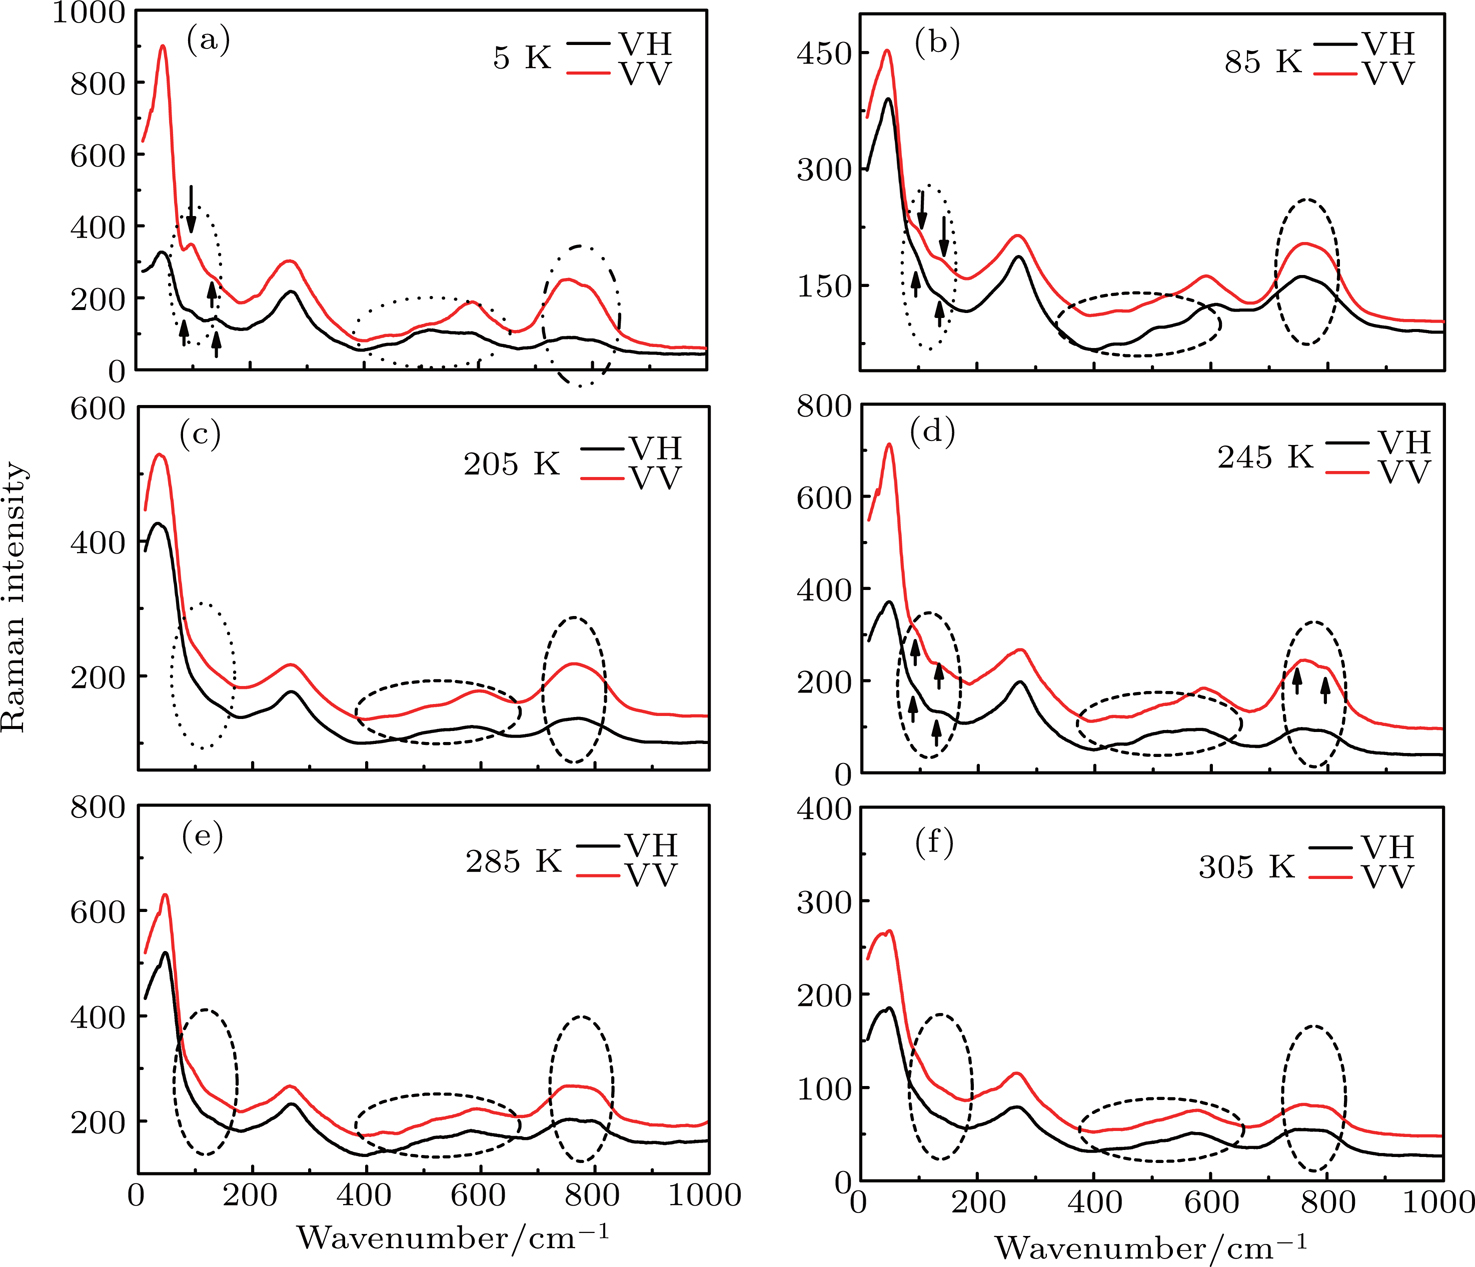
Figure 5(a)5(f) exhibit the contrast of the VV and VH polarization micro-Raman spectra at specific temperatures. As the temperature increases, the Raman spectra in the ranges of 90–150 cm−1, 400–600 cm−1, and 700–800 cm−1 show the notable changes, as shown by the ellipses and black arrows. In Figs. 5(a)5(d), the VV and VH spectra significantly depend on the polarization. However, the VH and VV spectra in Figs. 5(e) and 5(f) are similar, neither polarization dependent nor temperature dependent. Yang et al.[14] reported that the VV and VH spectra of MA with Cm space group are nearly the same, while the spectra of MC with Pm space group exhibit remarkable dependence on the polarization configurations. Thus, the MC structure is suggested in the temperature range from 5 K to 245 K, and it gradually transforms into the MA with Cm space group near 270 K, as shown in Fig. 2. When the temperature further increases to 285 K, the main phase structure is MA, which is consistent with Fig. 1. Although no phase transformation occurs in the temperature range from 5 K to 245 K, the thermal dynamic of local structure is suggested to contribute to these various Raman scattering (Figs. 35) and dielectric properties (Fig. 2).[14,17,18]

Fig. 5. Polarized micro-Raman spectra of [001]-oriented PMN–33PT crystal at specific temperatures.

The chemical fluctuations as a result of the substitution of multiple B-site cations (Mg2+, Nb5+, and Ti4+/Ti3+) in PMN–33PT crystal induce the formation of PNRs.[3] The interaction between the PNRs and the bulk lattice can introduce an underlying structural instability,[4,26] which results in the MA phase transformation toward MC at 270 K, as shown in Fig. 2. Under the effect of temperature, the relaxational thermal dynamics of PNRs induces the polarization rotation of PNRs,[1,5] leading to the dielectric relaxor and 60% contribution to room temperature dielectric constant in the temperature range from 5 K to 245 K. We propose that the phase instability and polarization rotation of PNRs at low temperature range can play a key role to the room-temperature ultrahigh dielectric properties in [001]-oriented PMN–33PT crystal.

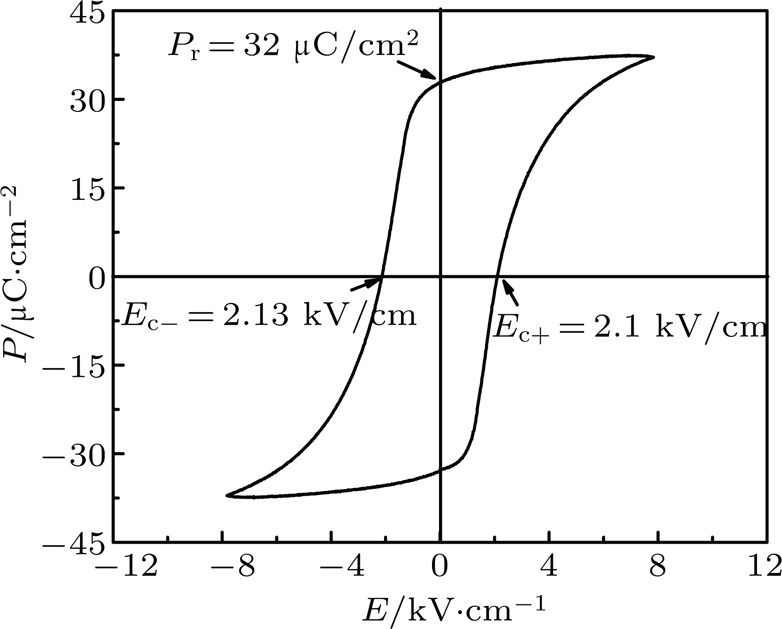
As is known, the ferroelectric and piezoelectric properties are very important for relaxor ferroelectric crystals. We have measured the piezoelectric coefficient (d33 = 2051 pC/N) and PE loop at room temperature, as shown in Fig. 6. The [001]-oriented PMN–33PT crystal shows the remanent polarization /cm2. One can see that the positive coercive field Ec+ = 2.1 kV/cm is close to the negative coercive field Ec− = 2.13 kV/cm, indicating a little internal bias field and high quality crystal[27] grown by modified Bridgeman method in our work.

Fig. 6. PE loop of [001]-oriented PMN–33PT crystal at room temperature.
4. Conclusion

The dielectric measurement and Raman spectrum of [001]-oriented PMN–33PT crystal are collected in the low temperature range from 300 K to 5 K to investigate the evolution of microstructure and the origin of ultrahigh dielectric properties. Raman spectrum and dielectric measurement reveal that the MA is the dominant phase structure at room temperature. As the temperature drops below ambient temperature, the MA phase gradually transforms to the MC phase by an ergodic process near 270 K. No phase transition presents in the temperature range from 245 K to 5 K, suggesting the MC symmetry remains. The strong dielectric relaxor between 5 K and 245 K is attributed to the relaxational thermal dynamics of PNRs. The origin of ultrahigh dielectric constant is associated with thermal dynamics of PNRs and phase instability. The crystal shows excellent piezoelectric and ferroelectric properties d33 = 2051 pC/N and /cm2.

Reference
[1] Li F Zhang S Xu Z Chen L 2017 Adv. Funct. Mater. 27 1700310
[2] Wang R Xu H Yang B Luo Z Sun E Zhao J Zheng L Dong Y Zhou H Ren Y Cao W 2016 Appl. Phys. Lett. 108 152905
[3] Kim K Paynea D Zuo J 2013 J. Appl. Cryst. 46 1331
[4] Xu G Wen J Stock C Gehring P M 2008 Nat. Mater. 7 562
[5] Li F Zhang S Yang T Xu Z Zhang N Liu G Wang J Wang J Cheng Z Ye Z Luo J Shrout T R Chen L 2016 Nat. Commun. 7 13807
[6] Li F Lin D B Chen Z B Cheng Z X Wang J L Li C C X Z Huang Q W Liao X Z Chen L Q Shrout T R Zhang S J 2018 Nat. Mater. 17 349
[7] Tan H X Takenaka H Xu C S Duan W H Grinberg I Rappe A M 2018 Phys. Rev. 97 174101
[8] Harby A E Hannora A E El-Desoky M M 2019 J. Alloys Compound. 770 906
[9] Xu C Li Q Yan Q Luo N Zhang Y Chu X 2016 J. Am. Ceram. Soc. 99 2706
[10] Xu G Luo H Xu H Yin Z 2001 Phys. Rev. 64 020102 (R)
[11] Zheng L Lu X Shang H Xi Z Wang R Wang J Zheng P Cao W 2015 Phys. Rev. 91 184105
[12] Bao P Yan F Lu X Zhu J Shen H Wang Y Luo H 2006 Appl. Phys. Lett. 88 092905
[13] Wan Y Li Z Ma M Li F Xu Z Fan S Yao X 2014 J. Adv. Dielect. 4 1450004
[14] Yang Y Zhang L Zhu M Liu Y 2011 J. Appl. Phys. 109 083517
[15] Noheda B Cox D Shirane G Gao J Ye Z G 2002 Phys. Rev. 66 054104
[16] Bai F Wang N Li J Viehl D Gehring P M Xu G Shirane G 2004 J. Appl. Phys. 96 1620
[17] Yang Y Liu L Zhang Y Zhu K Ma S Siu G G Xu Z Luo H 2010 J. Raman Spectrosc. 41 1735
[18] Slodczyk A Daniel P Kania A 2008 Phys. Rev. 77 184114
[19] Li F Zhang S J Xu Z Wei X Y Luo J Shrout T R 2010 J. Appl. Phys. 108 034106
[20] Dietze M Katzke H Souni M E Neumann N Luo H S 2012 Appl. Phys. Lett. 100 242905
[21] Priya S Viehl D Uchino K 2002 Appl. Phys. Lett. 80 4217
[22] Stock C Van Eijck L Fouquet P Maccarini M Gehring P M Xu G Luo H Zhao X Li J F Viehland D 2010 Phys. Rev. 81 144127
[23] Li F Zhang S J Damjanovic D Chen L Q Shrout T R 2018 Adv. Funct. Mater. 28 1801504
[24] Svitelskiy O Toulouse J Ye Z 2003 Phys. Rev. 68 104107
[25] Marssi M E Dammak H 2007 Solid State Commun. 142 487
[26] Manley M Lynn J Abernathy D Specht E D Delaire O Bishop A R Sahul R Buda J D 2014 Nat. Commun. 5 3683
[27] Luo N N Zhang S J Li Q Yan Q F Zhang Y L Ansell T Luo J Shrout T R 2016 J. Mater. Chem. 4 4568