Conductive property of Zr0.1Fe0.9V1.1Mo0.9O7 with low thermal expansion
He Xiaoke1, Qi Heng1, Xu Qi1, Liu Xiansheng2, †, Xu Lei1, Yuan Baohe1, ‡
North China University of Water Resources and Electric Power, Zhengzhou 450011, China
Henan Key Laboratory of Photovoltaic Materials, Henan University, Kaifeng 475004, China


† Corresponding author. E-mail: liuxiansheng69@126.com yuanbaohe@ncwu.edu.cn

Abstract
Abstract

Low thermal expansion materials are mostly ceramics with low conductive property, which limits their applications in electronic devices. The poor conductive property of ceramic ZrV2O7 could be improved by bi-substitution of Fe and Mo for Zr and V, accompanied with low thermal expansion. Zr0.1Fe0.9V1.1Mo0.9O7 has electrical conductivity of 8.2×10⁻⁵ S/cm and 9.41×10⁻⁴ S/cm at 291 K and 623 K, respectively. From 291 K to 413 K, thermal excitation leads to the increase of carrier concentration, which causes the rapid decrease of resistance. At 413–533 K, the conductivity is unchanged due to high scattering probability and a slowing increase of carrier concentration. The conductivity rapidly increases again from 533 K to 623 K due to the intrinsic thermal excitation. The thermal expansion coefficient of Zr0.1Fe0.9V1.1Mo0.9O7 is as low as 0.72×10⁻⁶ K−1 at 140–700 K from the dilatometer measurement. These properties suggest that Zr0.1Fe0.9V1.1Mo0.9O7 has attractive application in electronic components.

1. Introduction

Metal materials have excellent conductivity, but their thermal expansion property could induce thermal stress and even function failure. Meanwhile, ceramic materials have low thermal expansion coefficients but their conductivities are usually poor. Recent investigations suggest that negative thermal expansion materials could be used to prepare low thermal expansion materials by partial ion substitution, doping, or compounding with positive thermal expansion materials,[13] which could also result in high conductivity.[48]

ZrV2O7 is one of the isotropic negative thermal expansion materials but its negative thermal expansion is only present after a phase transition.[9] P5+ ion has been used to substitute V5+ in ZrV2O7 to decrease the phase transition temperature and realize low thermal expansion. ZrV2−xPxO7 ( ) showed lower phase transition temperature at 340 K for x = 0.4.[10] The heterovalent ion substitution of Mo6+ or W6+ for V5+ in ZrV2O7 could not reduce the phase transition temperature obviously.[11,12] Dual-ion substitutions of Cu2+/P5+ or Fe3+/P5+ for Zr4+/V5+ in ZrV2O7 have also been investigated but it is difficult to reach a high solubility of the dopants.[13,14] However, dual-ion Fe3+/Mo6+ or Al3+/Mo6+ for Zr4+/V5+ in ZrV2O7 could lead to a low thermal expansion material.[15,16] Even near zero thermal expansion can be obtained (Zr0.1Fe0.9V1.1Mo0.9O7) by dual-ion substitutions of Fe3+/Mo6+ for Zr4+/V5+ in ZrV2O7.[15]

ZrV2O7 has poor conductivity at room temperature (RT), which is increased with increasing temperature (σ = 3.56×10⁻³ S/cm at 573 K).[13,17] The introduction of Cs in ZrV2O7 could enhance the ionic conductivity. Charge transport in VO4 could provide the observed high ionic conductivity.[18,19] In this paper, dual-ion substitutions of Fe3+/Mo6+ for Zr4+/V5+ in ZrV2O7 are investigated to increase the conductivity of ZrV2O7. Zr0.1Fe0.9V1.1Mo0.9O7 is found with electrical conductivity σ = 8.2 ×10⁻⁵ and 9.41 ×10⁻⁴ S/cm at 291 K and 623 K, and activation energy Ea = 0.160 eV and 0.233 eV for 291–413 K and 533–623 K, calculated from the Arrhenius plots for the total conductivity.

2. Experiments

Zr0.1Fe0.9V1.1Mo0.9O7 was synthesized by a solid state method with raw materials Fe2O3, ZrO2, MoO3, and V2O5. The raw materials were mixed according to stoichiometric amounts of Zr0.1Fe0.9V1.1Mo0.9O7 (with excess 5 mol% V2O5) and ground in a mortar for 3 h. The homogenized raw materials were pressed into 10 mm ×2.5 mm (diameter ×height) cylindrical pellets, sintered in a tubular furnace at 5 K/min heating rate, held at 953 K for 2–5 h, and then cooled down slowly to RT.

X-ray diffraction (XRD, Bruker D8 Advance Diffractometer) was used to analyze the crystal phase of the sample. Microstructures were checked using scanning electron microscopy (SEM, JSM-6700 F) and elements were analyzed with energy dispersive spectrum (EDS). Pellet electrical conductivity was measured after polishing and coating both surfaces with Ag paste. Complex impedance was measured using a frequency response analyzer (1 Hz to 4 MHz) in the temperature range from RT to 623 K. The linear thermal expansion coefficients were measured on dilatometers (LINSEIS DIL L75), with heating and cooling rates of 5 K/min.

3. Results and discussion

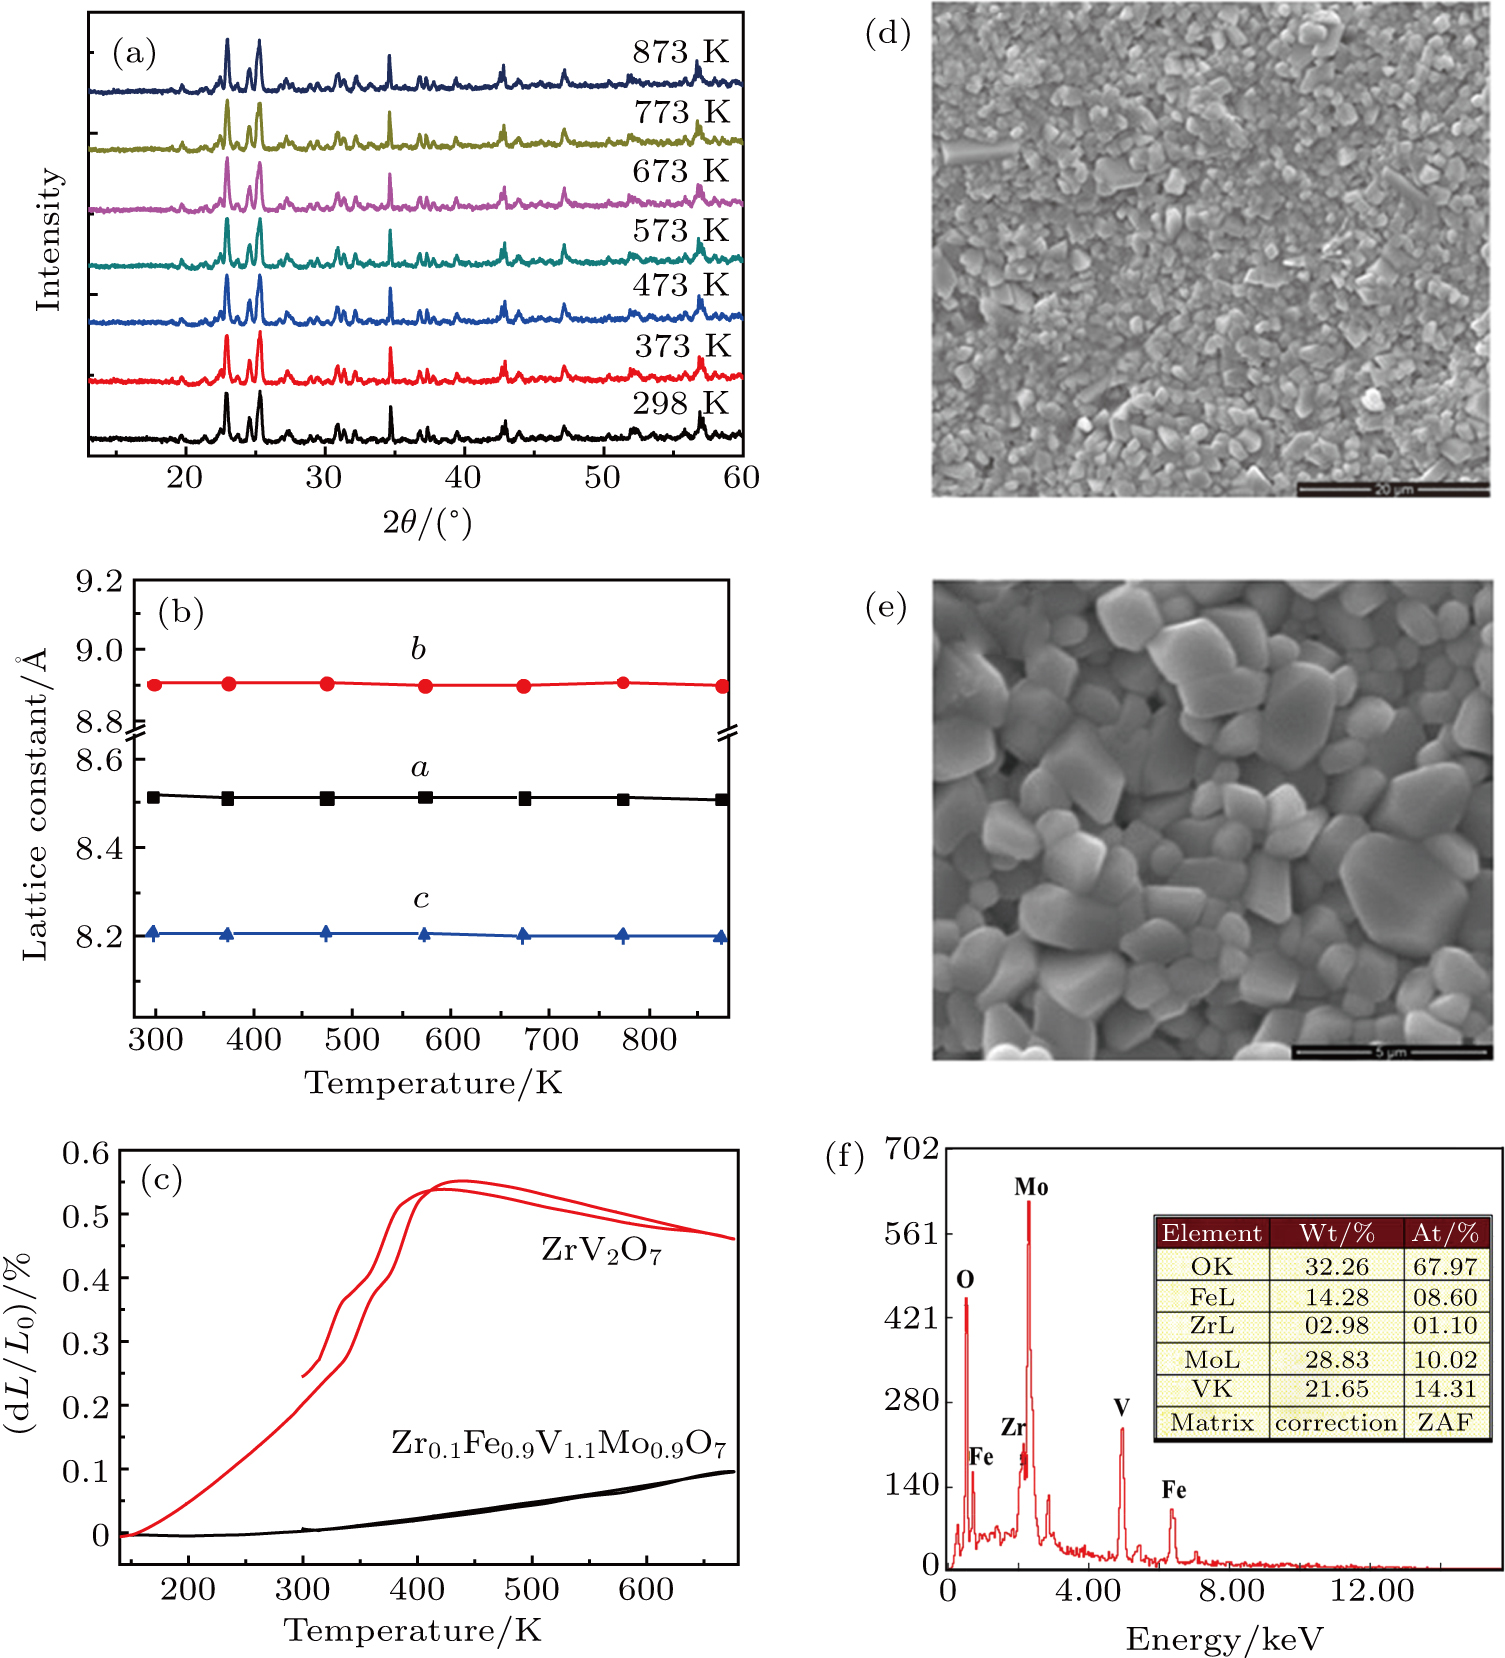
Figure 1(a) shows the temperature dependent XRD patterns of Zr0.1Fe0.9V1.1Mo0.9O7 from RT to 873 K. The lattice parameters of Zr0.1Fe0.9V1.1Mo0.9O7 are calculated using the least-square method with PowderX program,[20] which decrease with increasing temperature (Fig. 1(b)). The detailed linear coefficients of thermal expansion of Zr0.1Fe0.9V1.1Mo0.9O7 along the a, b, and c axes are −0.4×10⁻⁶ K−1, −0.97×10⁻⁶ K−1, and −1.22×10⁻⁶ K−1, respectively (RT–873 K). However, by the dilatometer measurement, the coefficient of thermal expansion of Zr0.1Fe0.9V1.1Mo0.9O7 is determined to be 0.72×10⁻⁶ K−1 from 140 K to 673 K (Fig. 1(c)). The different results from temperature dependent XRD and dilatometer measurement could relate to the microstructure and thermal hysteresis of ceramics Zr0.1Fe0.9V1.1Mo0.9O7. The sample for temperature dependent XRD is much smaller than that for dilatometer. The XRD measurement begins after holding temperature for 5 min. However, the dilatometer measurement is continuous with temperature.

Fig. 1. (a) XRD patterns of Fe0.9Zr0.1V1.1Mo0.9O7 heated from RT to 873 K. (b) Dependence of lattice constants on temperature of orthorhombic Zr0.1Fe0.9V1.1Mo0.9O7. (c) Relative length change of ZrV2O7 and Zr0.1Fe0.9V1.1Mo0.9O7 from 140 K to 673 K. (d), (e) SEM images and (f) EDS of orthorhombic Zr0.1Fe0.9V1.1Mo0.9O7.

Figures 1(d)1(f) show the SEM images and EDS of Fe0.9Zr0.1V1.1Mo0.9O7, respectively. The microstructure presents irregular particles and tiny pores. The pores could result in the above different coefficients. The EDS shows that the elements in the sample include Zr, Fe, Mo, V, and O. From the EDS, the atomic percentages of Zr, Fe, Mo, V, and O in the sample are 1.10%, 8.60%, 10.02%, 14.31%, and 67.97%, respectively, which indicate that the atomic ratio of Zr, Fe, Mo, V, and O is close to .

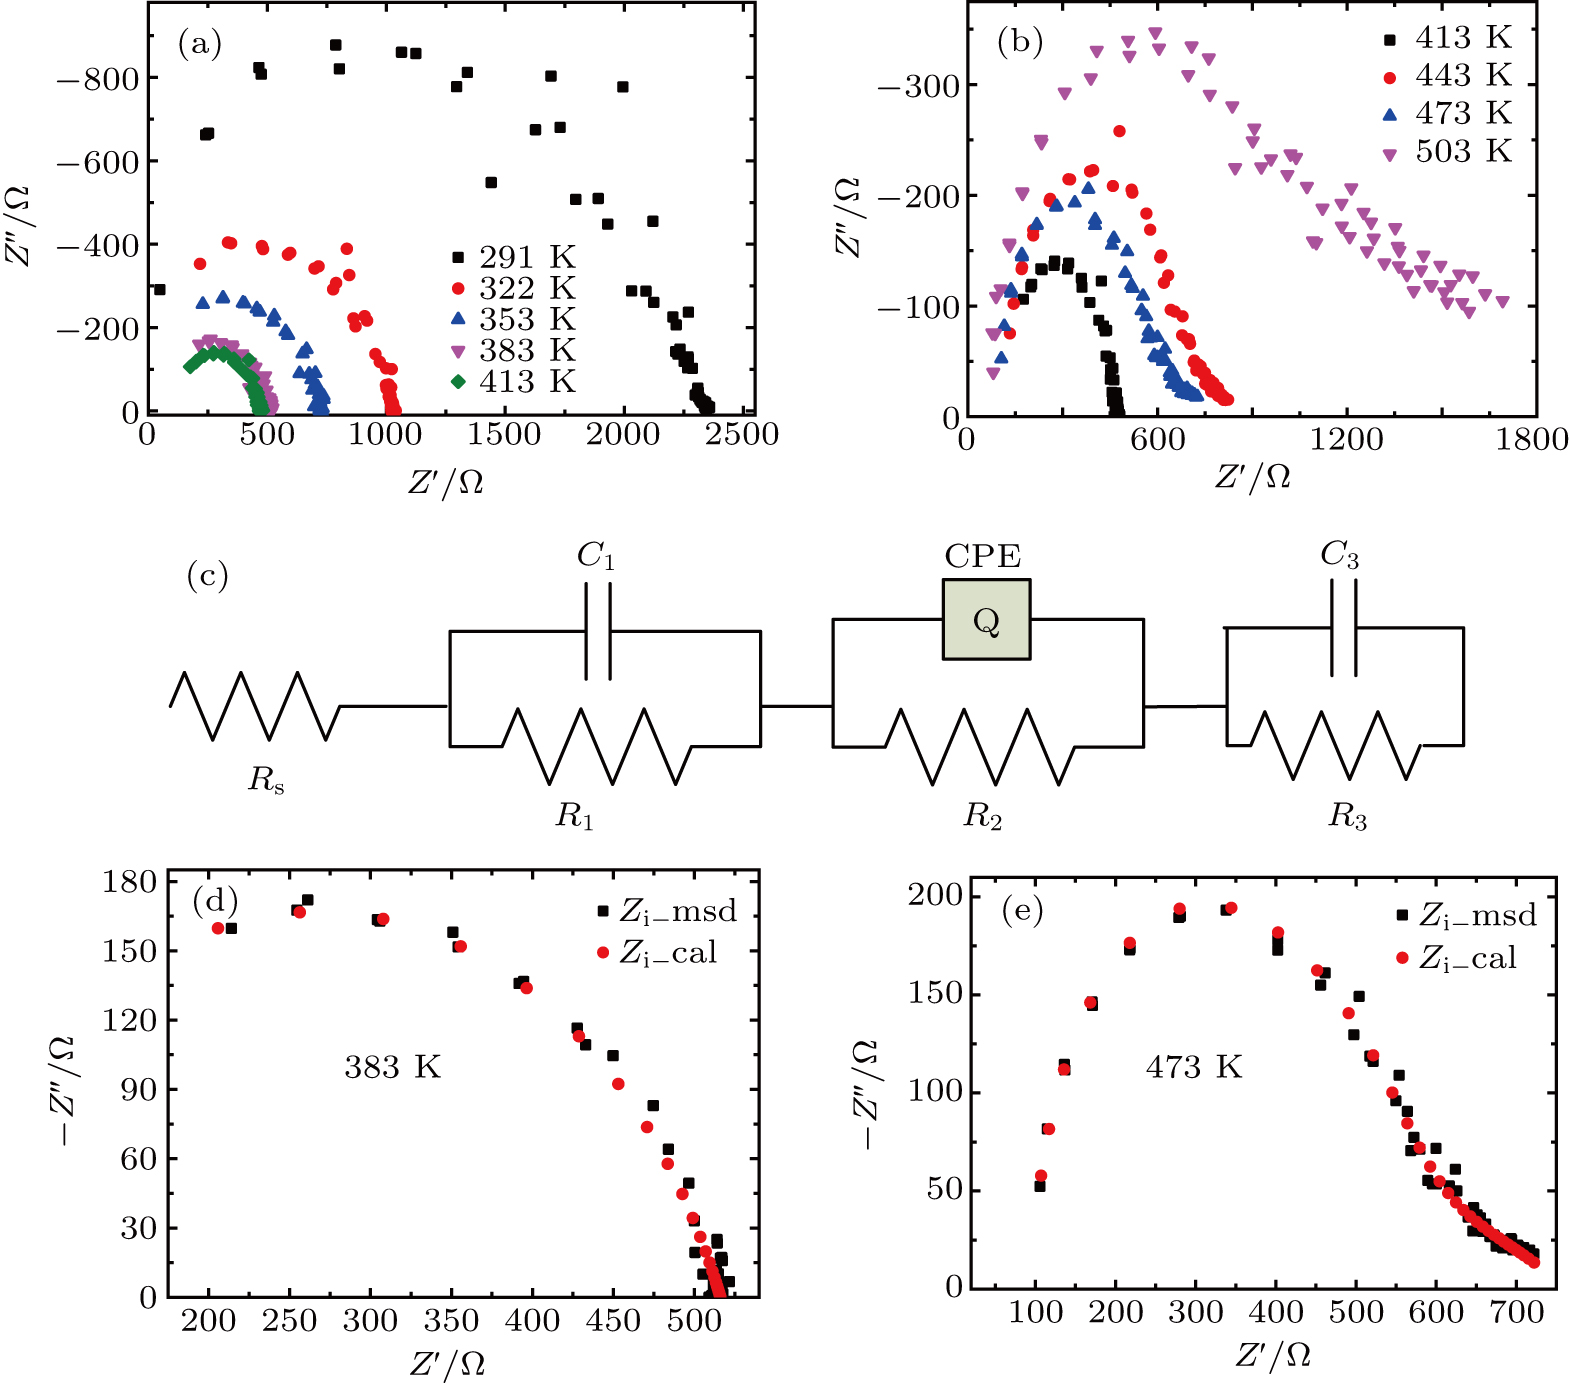
Figure 2(a) shows the impedance of Fe0.9Zr0.1V1.1Mo0.9O7 from 291 K to 413 K. The Nyquist plots present a series of arc, where the real axis (Z) corresponds to the contact resistance. With increasing temperature, the radius of the arc decreases, indicating a decrease of resistance. This is similar to the property of semiconductors due to the increase of carrier concentration with heating. At higher temperatures (413–503 K), the Nyquist plots (Fig. 2(b)) show a single semicircle at high frequency, where the real axis (Z) corresponds to the bulk resistance related to the superposition of grain and grain boundary effects. The Nyquist plots present little tails near low frequency, indicating ionic conductivity. These results are in consistent with the results on other ionic conductor materials.[2123] The Nyquist plots also suggest the increase of resistance with increasing temperature, just like conductor resistance increases with temperature. We use Zsimwin 3.30 program[24] to study the Nyquist curve after stabilization. The impedance of Fe0.9Zr0.1V1.1Mo0.9O7 is calculated by fitting the experimental data (Figs. 2(d) and 2(e)) to the equivalent circuits comprising of resistances Ri, capacitances Cj, and constant phase element CPE, in series and/or parallel, as shown in Fig. 2(c). The total impedance and admittance are

where
are real and imaginary impedances, respectively.

Fig. 2. Representative Zr0.1Fe0.9V1.1Mo0.9O7 AC impedance spectra for (a) 291–413 K and (b) 413–473 K. (c) Equivalent circuit: Rs, R1, R2, and R3 are the electrical resistances of grain, grain boundary, and ion/electrode interface, respectively. Impedance spectra at 383 K (d) and 503 K (e).

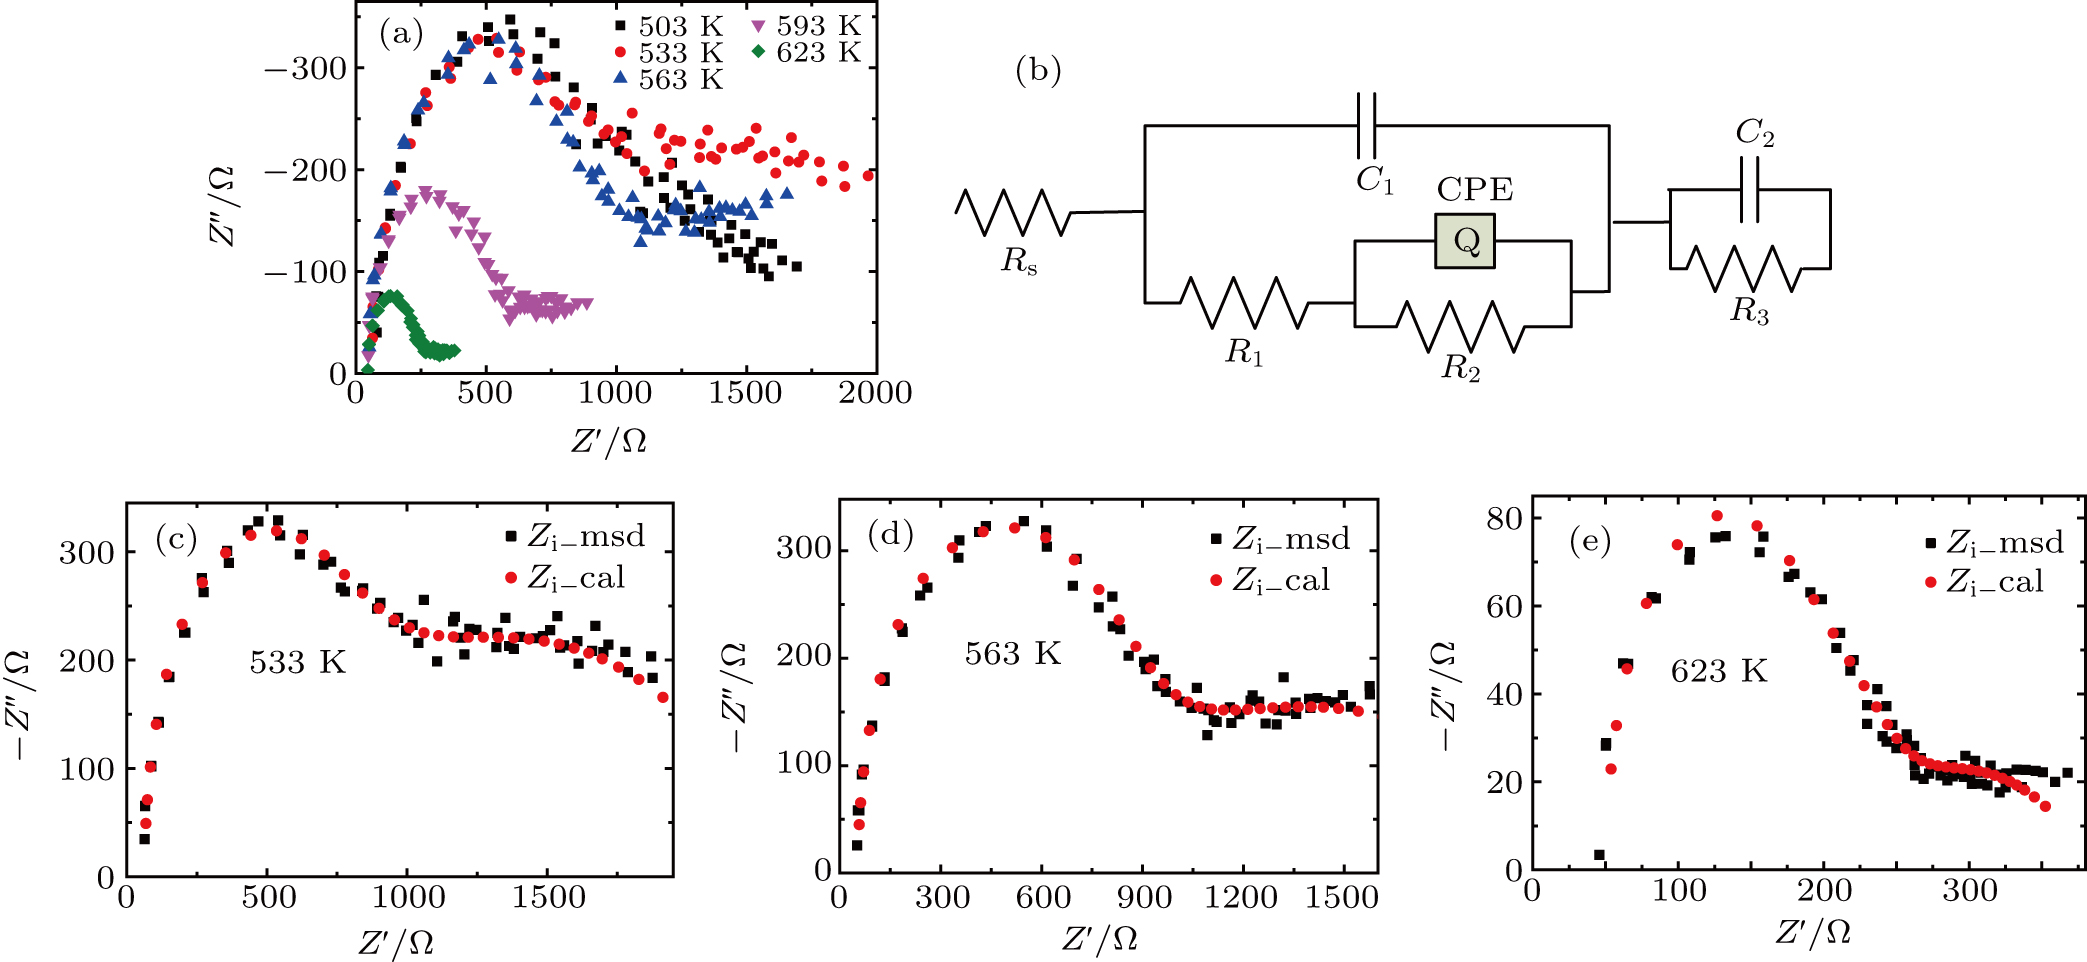
Figure 3(a) shows the impedance from 503 K to 623 K. The Nyquist plots present a single semicircle at high frequency, and have little tails at low frequency. The impedance of Fe0.9Zr0.1V1.1Mo0.9O7 is calculated by fitting the experimental data (Figs. 3(c)3(e)) to the equivalent circuits comprising of Ri, Cj, and CPE, in series and/or parallel, as shown in Fig. 3(b). The Nyquist plots show that the total resistance of the material does not change and then decreases as the temperature increases, which could relate to the increase of carrier concentration by intrinsic excitation with heating.

Fig. 3. (a) Representative Zr0.1Fe0.9V1.1Mo0.9O7 AC impedance spectra for 503–623 K. (b) Equivalent circuit: Rs, R1, R2, and R3 are the electrical resistances of grain, grain boundary, and ion/electrode interface, respectively. Impedance spectra at (c) 533 K, (d) 563 K, and (e) 623 K.

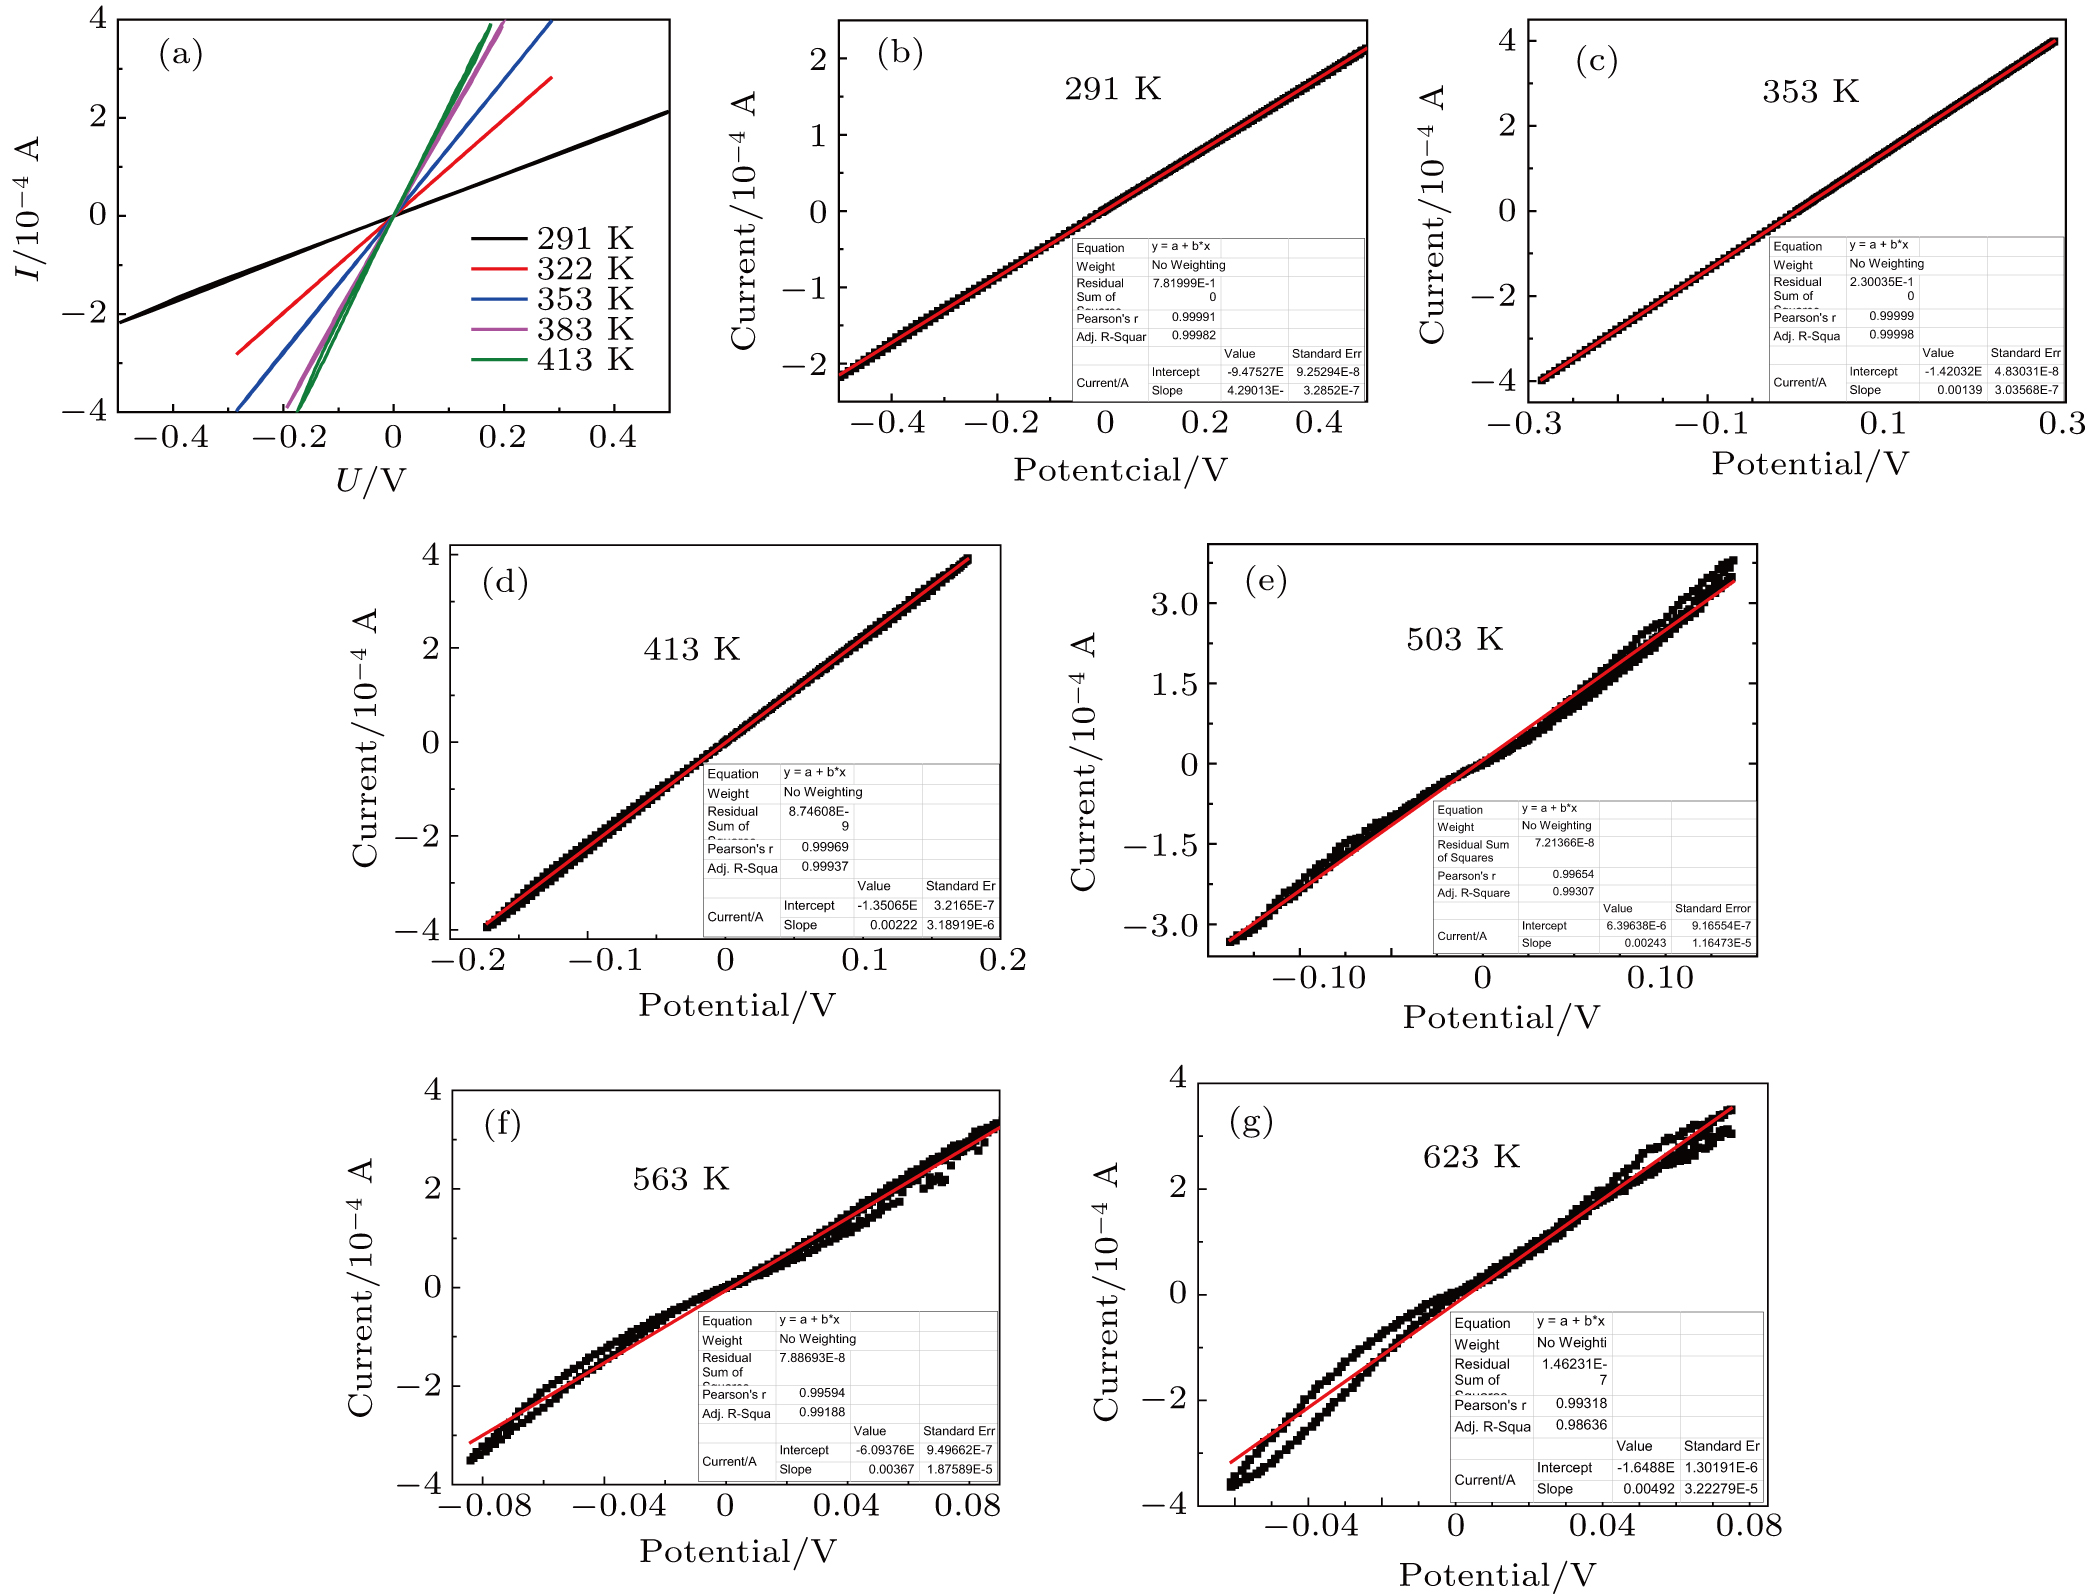
To obtain appropriate resistance dependence on temperature, we measured direct-current (DC) current–voltage (IV) characteristics of Zr0.1Fe0.9V1.1Mo0.9O7 at different temperatures (Fig. 4). The conductance is calculated using the least square method. The total resistance is calculated by . The results are consistent with the impedance spectra.

Fig. 4. (a)–(g) The DC IV curves from 291 K to 623 K of Zr0.1Fe0.9V1.1Mo0.9O7.

The conductivity σ can then be calculated from[25]

where d is the thickness, A is the area of the electrode, and R is the electrical resistance. Figure 5 shows the temperature dependent resistance, conductivity, and total conductivity

Fig. 5. Zr0.1Fe0.9V1.1Mo0.9O7 total electrical resistance (a) and (b) conductivity, and (c) Arrhenius plots for the total conductivity.

Arrhenius plots for Zr0.1Fe0.9V1.1Mo0.9O7 in normal atmosphere. The values of σ are calculated to be 8.2 ×10⁻⁵ S/cm, 3.80 ×10⁻⁴ S/cm, 4.16 ×10⁻⁴ S/cm, and 9.41 ×10⁻⁴ S/cm at 291 K, 383 K, 473 K, and 623 K, respectively. The linear relationship of conductivity with temperature (Fig. 5(c)) could relate to no phase transitions at 291–413 K. The relaxation process activation energy Ea of Zr0.1Fe0.9V1.1Mo0.9O7 at higher temperatures and RT could be calculated to be 0.233 eV and 0.160 eV using Arrhenius expression , where α is the pre-exponential factor, k is Boltzmann’s constant, and T is the absolute temperature.[14]

Carrier concentration could be controlled by temperature.[2628] The conductivity of Zr0.1Fe0.9V1.1Mo0.9O7 is larger than that of ZrV2O7.[14] This could be related to the substituting effect of Fe3+/Mo6+ for Zr4+/V5+ in ZrV2O7, like p type doping ( and n type doping ( ) in semiconductor. Fe/Mo co-doping induces the band gap of ZrV2O7 to narrow down. Thermal excitation in Zr0.1Fe0.9V1.1Mo0.9O7 (0.160 eV) is easier than that in ZrV2O7 (0.319 eV). Meanwhile, the strong interaction between the formed ( and ( results in low thermal expansion in Zr0.1Fe0.9V1.1Mo0.9O7. The conductivity presents an obvious change at 413–533 K, which could result from high scattering probability and slowing-down increase of conductive particle number. However, the conductivity increases with increasing temperature (533–623 K), which may be related to the intrinsic thermal excitation of semiconductor.

4. Conclusion

Zr0.1Fe0.9V1.1Mo0.9O7 shows near zero thermal expansion and high conductivity. The conductivities of Zr0.1Fe0.9V1.1Mo0.9O7 are 8.2×10⁻⁵ S/cm, 3.80×10⁻⁴ S/cm, 4.16×10⁻⁴ S/cm, and 9.41×10⁻⁴ S/cm at 291 K, 383 K, 473 K, and 623 K, respectively. The electrical conductivity is linear for 291–413 K, and the activation energy is 0.160 eV. At 533–623 K, the activation energy is 0.233 eV, indicating that Zr0.1Fe0.9V1.1Mo0.9O7 acts like a classical doped semiconductor. Thermal excitation leads to carrier concentration increase from RT to 413 K, which leads to a rapid resistance decrease. The unchanged conductivity during 413–533 K is due to high scattering probability and slowing-down increase of carrier concentration. The intrinsic thermal excitation leads to rapid increase of conductivity at 533–623 K.

Reference
[1] Ge X H Mao Y C Li L Li L P Yuan N Cheng Y G Guo J Chao M J Liang E J 2016 Chin. Phys. Lett. 33 046503
[2] Liang Y Cheng Y G Ge X H Yuan B H Guo J Sun Q Liang E J 2017 Chin. Phys. 26 106501
[3] Wang W L Meng L J Li L H Hu L Zhou K Kong Z H Wei B B 2016 Chin. Phys. Lett. 33 116102
[4] Huang R J Wu Z X Chu X X Yang H H Chen Z Li L F 2010 Solid State Sci. 12 1977
[5] Chen D X Yuan B H Cheng Y G Ge X H Jia Y Liang E J 2016 Phys. Lett. 380 4070
[6] Yanase I Sakai H Kobayashi H 2017 Mater Lett. 207 221
[7] Chen J Wang F F Huang Q Z Hu L Song X P Deng J X Yu R B Xing X R 2013 Sci. Rep. 3 2458
[8] Yao W J Jiang X X Huang R J Li W Huang C J Lin Z S Li L F Chen C T 2014 Chem. Commun. 50 13499
[9] Withers R L Evans J S O Hanson J Sleight A W 1998 J. Solid State Chem. 137 161
[10] Yuan H L Yuan B H Li F Liang E J 2012 Acta Phys. Sin. 61 226502 in Chinese
[11] Sahoo P P Sumithra S Madras G Row T N G 2011 Inorg. Chem. 50 8774
[12] Liu Q Q Yang J Sun X J Cheng X N Tang H Li H H 2014 Appl. Surf. Sci. 313 41
[13] Yuan B H Yuan H L Song W B Liu X S Cheng Y G Chao M J Liang E J 2014 Chin. Phys. Lett. 31 076501
[14] Yuan B H Liu X S Song W B Cheng Y G Liang E J Chao M J 2014 Phys. Lett. 378 3397
[15] Yuan B H Liu X S Mao Y C Wang J Q Guo J Cheng Y G Song W B Liang E J Chao M J 2016 Mater. Chem. Phys. 170 162
[16] Yuan B H Cao W S Ge X H Cheng Y G Liu X S Liang E J 2017 Acta Phys. Sin. 66 076501 in Chinese
[17] Yuan B H He X K Chen L L Wang W S Cheng T Liang E J 2018 Ceram. Int. 44 21621
[18] Nakajima T Isobe M Tsuchiya T Ueda Y Manabe T 2010 J. Phys. Chem. 114 5160
[19] Elkady M F Alrafaa M A El Essawy N A Beni-seuf U 2014 J. Appl. Sci. 3 229
[20] Dong C Wu F Chen H 1999 J. Appl. Cryst. 32 850
[21] Zhou Y K Adams S Rao R P Edwards D D Neiman A Pestereva N 2008 Chem. Mater. 20 6335
[22] Suzuki T Omote A 2004 J. Am. Ceram. Soc. 87 1365
[23] Omote A Yotsuhashi S Zenitani Y Yamada Y 2011 J. Am. Ceram. Soc. 94 2285
[24] Yu J M Chao M J Li D C Li M Y 2013 J. Power Sources 226 334
[25] Tripathy A Das S N Pradan S K Bhuuan S Choudhary R N P 2018 J. Mater. Sci. Mater. Electron. 29 4770
[26] Hsu K Y Wang C Y Liu C P 2010 J. Electron. Soc. 157 K109
[27] Ye C Fang X Wang M Zhang L 2006 J. Appl. Phys. 99 063504
[28] Pejova B Abay B Bineva I 2010 J. Phys. Chem. 114 15280