On-node lattices construction using partial Gauss–Hermite quadrature for the lattice Boltzmann method
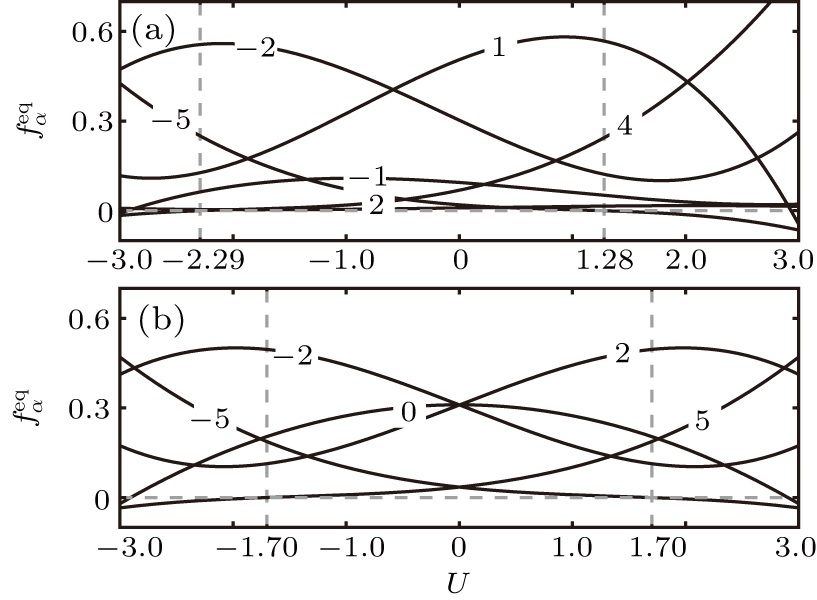
The profiles of equilibrium distributions

On-node lattices construction using partial Gauss–Hermite quadrature for the lattice Boltzmann method |
|
The profiles of equilibrium distributions |
 |