|
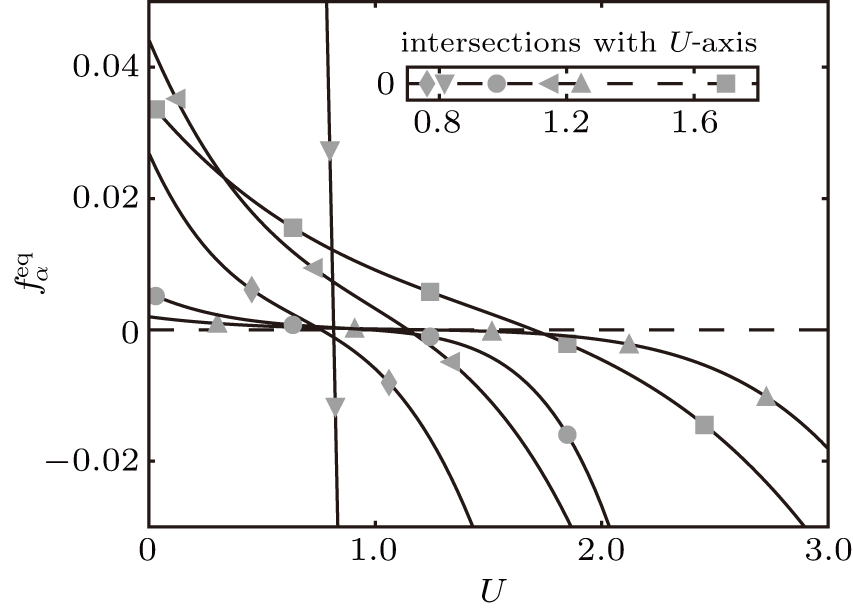
The profiles of first-going-negative equilibrium distributions
f
α
eq
as a function of U. The figure only renders the positive U-axis. Since all lattices in the figure are symmetric, the positivity on the negative U-axis is the same though the corresponding
v
α
turns to
−
v
α
. The line with symbol
▾
is for
f
α
eq
with
v
α
=
0
and
c
=
1
/
2
RT
=
1.2247
which, as U increases, first goes negative in all equilibrium distributions of
{
0
,
±
1
}
;
■
is for
v
α
=
−
5
and c=0.3442 in
{
0
,
±
2
,
±
5
}
;
◀
is for
v
α
=
−
3
and c=0.5534 in {0,±1,±3};
♦
is for
v
α
=
−
2
and c=0.8464 in {0,±1,±2,±3};
▴
is for
v
α
=
−
5
and c=0.4794 in {0,±1,±2,±3,±5};
•
is for
v
α
=
−
3
and c=0.6859 in {0,±1,±2,±3,±4,±5}. The inner panel renders their intersections with the U-axis, above which the
f
α
eq
will become negative. The specific values of intersections for {
▾
,
■
,
◀
,
♦
,
▴
,
•
} are ∼{0.82, 1.70, 1.15, 0.76, 1.25, 0.98}. Since the plotted
f
α
eq
curves are the first-going-negative equilibrium distributions, then the inner panel demonstrates the lattices positivity range of U.
|