Effect of terahertz pulse on gene expression in human eye cells
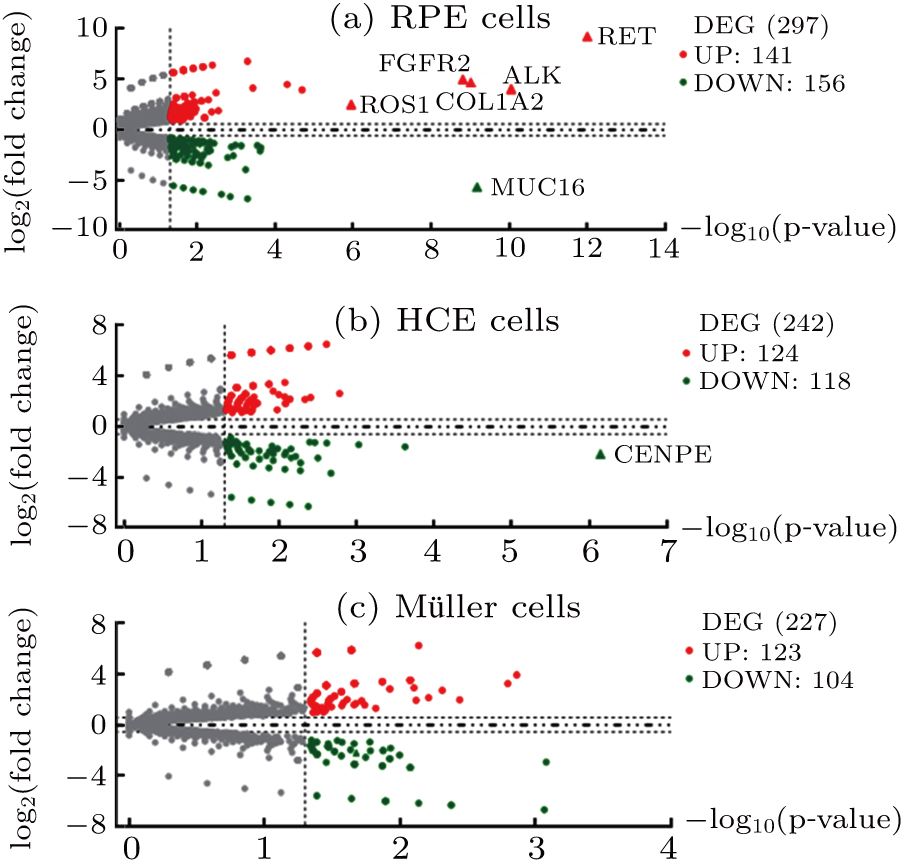
Volcano plots of gene expression profiles in (a) RPE, (b) HCE, and (c) Müller cells. Fold change of expression magnitude is plotted versus level of statistical significance (transformed into a logarithmic scale). Note that red, green and gray color represent genes whose expression is considered up-regulated, down-regulated and unchanged, respectively. Besides, triangles represent the DEGs with FDR-adjusted p-value