Cross-frequency network analysis of functional brain connectivity in temporal lobe epilepsy
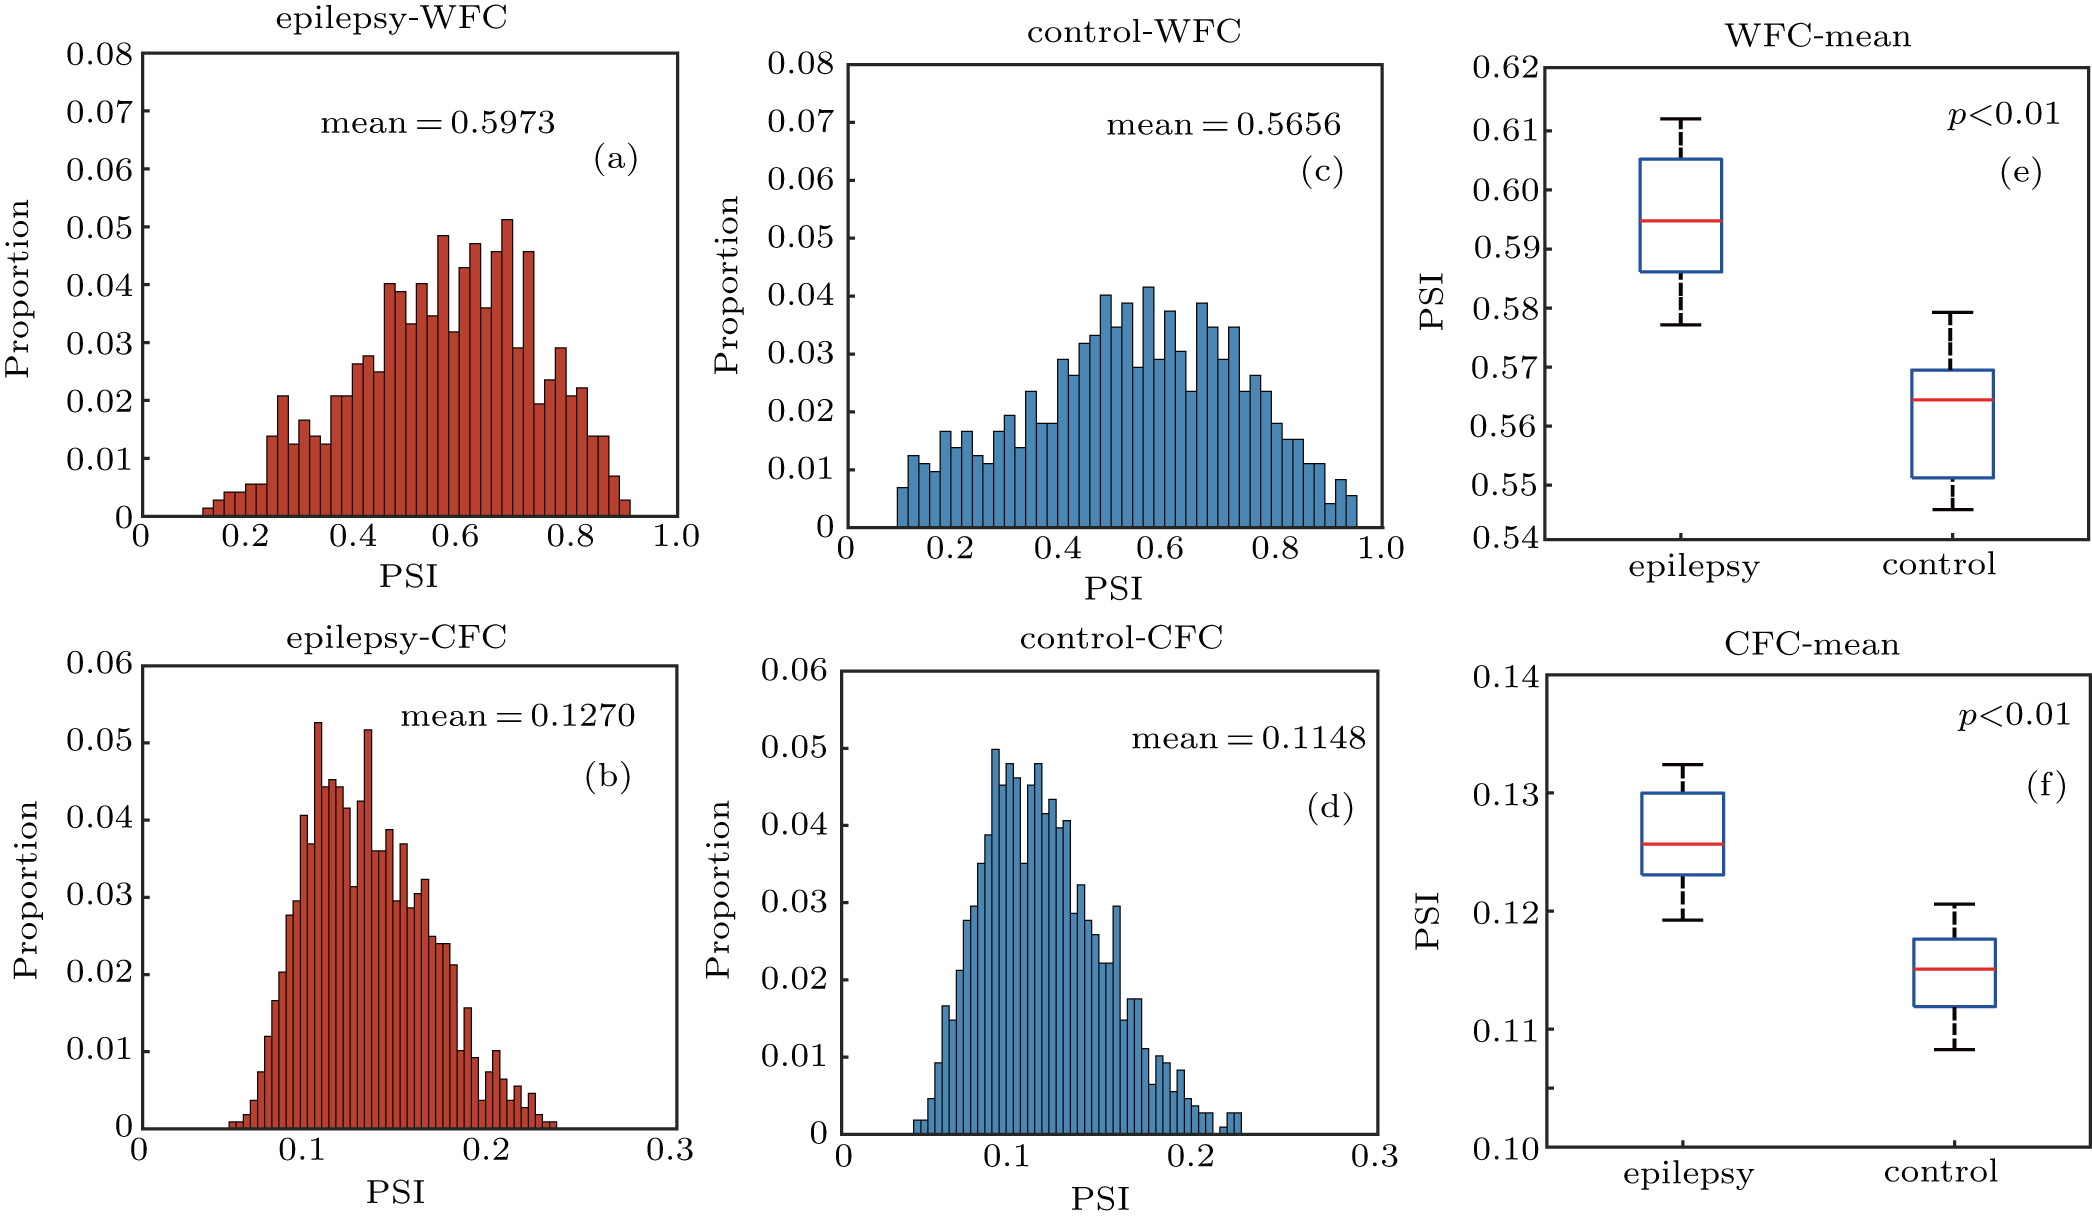
Distribution analysis of within and cross frequency phase synchronization index. (a) and (b) Distribution histogram of PSI for the epilepsy in WFC and CFC cases, (c) and (d) Distribution histogram of PSI for normal control in WFC and CFC cases. (e) and (f) Boxplot of the mean synchronization strength for the epilepsy and control groups in WFC case and CFC case. The bin widths of PSI histograms for WFC and CFC are 0.02 and 0.004 respectively. Note that the epilepsy group show higher mean synchronization strength (PSI) for both WFC and CFC.
