Cross-frequency network analysis of functional brain connectivity in temporal lobe epilepsy
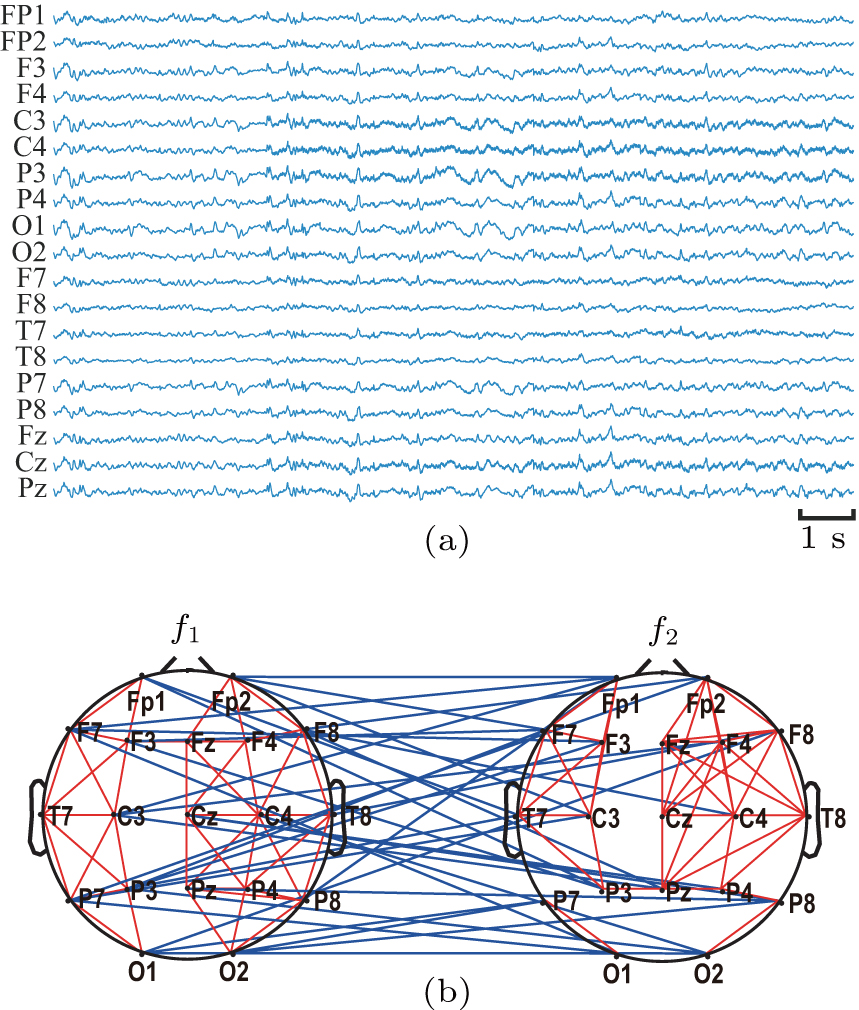
EEG data acquisition and schematic presentation of cross frequency network. (a) 15 seconds time series raw EEG signals (b) the cross-frequency network between theta and alpha bands. The red lines indicate the functional connectivity within specific bands, while the blue lines represent the connectivity between different bands (f1 and f2 ).