Structural evolution in deformation-induced rejuvenation in metallic glasses: A cavity perspective
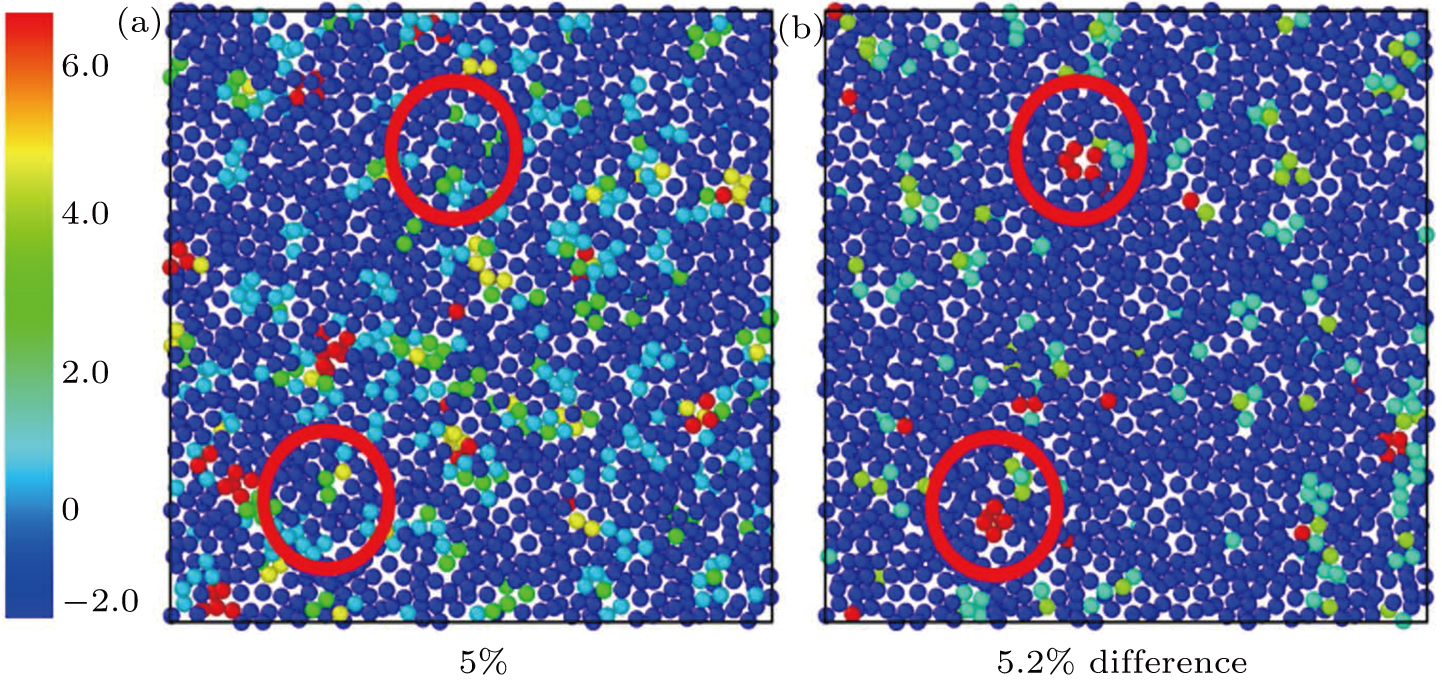
(a) Snapshot of cavity distribution in the sample of 0.1 K/ps at a strain of 5%; (b) the volume difference of cavities between the strain of 5.2% and 5%. The cross-section in the middle of the sample along the X direction is taken for the illustration. The color bar represents the cavity volume in panel (a) and volume difference in panel (b), respectively. The circles mark the regions without cavity in panel (a) and the corresponding volume difference in panel (b).