Effect of magnetic flow and external forcing current on mixed bursting in the pre-Bötzinger complex*

Project supported by the National Natural Science Foundation of China (Grant Nos. 11772069 and 11872003).

Guo Dou-Dou, Lü Zhuo-Sheng
School of Science, Beijing University of Posts and Telecommunications, Beijing 100876, China


† Corresponding author. E-mail: lvzhsh@amss.ac.cn

Project supported by the National Natural Science Foundation of China (Grant Nos. 11772069 and 11872003).

Abstract

The pre-Bötzinger complex (pre-BötC) in mammalian brainstem is essential for the generation of respiratory rhythms. Most dynamic studies on the pre-BötC neuron have been focused on its firing activities modulated by the ion conductances rather than that by the electromagnetic radiation or the external forcing current. In this paper, by adding the electromagnetic radiation and external forcing current to Park and Rubin’s model, we mainly investigate the influences of those two factors on the mixed bursting (MB) of single pre-BötC neuron. First, we explore how the variation of external forcing current affects the MB patterns of the system with non-vanishing magnetic flux. We classify the MB patterns and show their dynamic mechanism through fast-slow decomposition and bifurcation analysis. Then, by modifying the feedback coefficient, we further analyze the sole effect of electromagnetic radiation on the firing activities of the system. Our results may be instructive in understanding the dynamical behavior of pre-BötC neuron.

1. Introduction

Smith et al. confirmed that the pre-Bötzinger complex (pre-BötC) located in the brainstem is involved in the generation of respiratory rhythm in the mammalian nervous system.[1] To date, a number of studies have indicated that the pre-BötC is essential for normal breaths and sighs.[27] There is still no consensus, however, regarding the mechanism of the generation and modulation of the respiratory rhythm in humans, or furthermore, what causes respiratory rhythmic disease by interfering with these mechanisms. A better understanding towards the intrinsic dynamics of the pre-BötC can play an important role in addressing these issues.

Based on a single-compartment Hodgkin–Huxley (HH) formalism, Butera and his collaborators established two conductance-based models for both single as well as two-coupled cells in the pre-BötC.[8,9] Their models have been widely used to explore the general principles and mechanisms for rhythmic bursting of pre-BötC pacemaker cells. Based on Butera’s model, Best et al. explored the influences of parameters gtonic-e and gsyn-e on the network behavior.[10] Duan et al. compared the bursting patterns between the single and two-cell model network using dynamic analysis methods.[11]

Toporikova and Butera created a two-compartment model of an inspiratory pre-BötC neuron (TB model), whose somatic compartment developed from the previously described model and the dendritic compartment used the Li–Rinzel model which described the dynamics of Ca2+.[12,13] Considering that the voltage and the calcium-activated nonspecific cationic current can reciprocally regulate each other, Park and Rubin simplified the TB model and proposed a single-compartment model of pre-BötC inspiratory neuron.[14] They also showed five activity patterns in the two-parameter ([IP3], gNaP) space, among which we are mostly interested in the somatic–dendritic bursting that is usually presented as the mixed bursting (MB) in experimental observations.[15] Researchers have attempted to explain how ion conductances influence the MB patterns, and tried to explore the underlying dynamical mechanisms.[14,16,17]

According to the Faraday’s law of induction and the feedback effect, the electrical activities of neurons and the distribution of electromagnetic field inside and outside of neurons can influence each other. In fact, the neuronal system is sensitive to even slight stimulation applied to the neuron, and the continuous exchange of chemical ions (such as Na+ and K+) between the inside and outside of the nerve cell membrane can be triggered by an external stimulation thus putting out electrical pulses. Consequently, the dynamical behavior of neurons can change under the effect of magnetic flow or external forcing current. Li et al. built a mathematical model of neuron membrane current generated by electromagnetic radiation based on neuronal energy theory and then introduced it into the HH model.[18] Lv and Ma introduced the additive variable as magnetic flux into neuron model and discussed the electrical activities.[19,20] On the basis of Lv, Liu and Zhan explored the electrical activities of an improved M–L neuron model equipped with electromagnetic radiation and phase noise.[21] They found that the suprathreshold spiking of system is gradually reduced with the feedback coefficient k, which indicates that the coupling strength between magnetic flux and membrane potential is increased. Duan et al. investigated the effects of direct and alternating currents on dynamical activities of single pre-BötC neuron model featuring magnetic flux, and showed that regular bursting patterns are of different types with the direct current changed.[22] However, their analysis did not take into account the calcium dynamics in the model, nor did they examine the impact of the feedback coefficient of magnetic flux on the firing patterns. On the other hand, Gu et al. studied how the excitatory stimulus affects the number of spikes within a burst.[23] The difference is that we mainly focus on the effect of inhibition stimulus on the burst patterns.

As we have mentioned, most of the researches on pre-BötC dynamical systems focus only on the impact of ion channels on the firing activities of the systems, however, the dynamics of pre-BötC systems under magnetic flow effect are less considered. In this paper, based on a modified single-compartment pre-BötC model[14] appended with an external direct current and a magnetic flux, we would like to investigate the MB patterns of the system by changing the direct current. We would also elucidate the sole effect of magnetic flow on the system.

This paper has been organized as follows. Section 2 introduces the modified single-compartment pre-BötC neuron model featuring an electromagnetic radiation and an external forcing current. In Section 3, we explore how the MB patterns of the system depend on the direct current I under the magnetic flux. In addition, we determine bursting patterns via one-parameter and two-parameter bifurcation diagrams. In Section 4, we show the magnetic flow effect on somatic part in an MB solution as the feedback coefficient k1 varies. Finally, conclusions are given in the last section. All the bifurcation analysis in this paper are performed by XPPAUT.[24]

2. Model description

In this paper, we consider the following single compartment model of pre-BötC inspiratory neuron, which is a modification of Park and Rubin’s model by introducing the external forcing current I and the magnetic flux φ

where V is the membrane potential, n and h are gating variables for the voltage-gated potassium and sodium channel, respectively. The fourth variable φ describes the magnetic flux across membrane. The parameters INa, IK, IL, INaP, ICAN, and I represent Na+ current, delated-rectifier K+ current, leakage current, persistent sodium current, calcium-activated nonspecific cationic current, and the external forcing current, respectively. In detail,
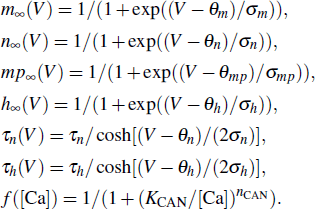
with
The function ρ(φ) has been used to refer to the memory conductance of a magnetic flux-controlled memristor,[25,26] and here is used to describe the coupling strength between magnetic flux and membrane potential of neuron as ρ(φ) = α + 3βφ2 in which α, β are fixed parameters.[27] The interaction between membrane potential and magnetic flux is described by the parameters k1 and k2. The term k1ρ(φ)V describes the inhibitory modulation on membrane potential. In this article, the parameters are selected as k = 0.01, k2 = 2.5 s−1, α = 1 MΩ−1, and β = 0.0006 MΩ−1 · V−2 · s−2.

The calcium dynamics is given as

where l refers to the fraction of IP3 channels in the membrane of the ER that have not been inactivated. The flux into the cytosol from the ER (JERIN) and the flux out of the cytosol into the ER (JEROUT) are described as follows:
where LIP3, PIP3, KI, and Ka represent ER leak permeability, maximum total ER permeability, dissociation constants for IP3 receptor activation by IP3 and Ca2+, respectively. VSERCA is the maximal SERCA pump rate, KSERCA sets the half-activation of the SERCA pump, and [Ca]ER is computed as , where σ is the ratio of cytosolic to ER volume.

If setting k1 = 0, I = 0, the system in Eqs. (1)–(6) is just equivalent to Park and Rubin’s model whose bursting patterns are included in Appendix A. The corresponding parameter values are specified in Appendix B. Similar to the terminology used by Park and Rubin, we call system in Eqs. (1)–(6) the full system, Eqs. (1)–(4) the somatic subsystem, and call system in Eqs. (5)–(6) the dendritic subsystem.

3. Mixed bursting related to both I and φ

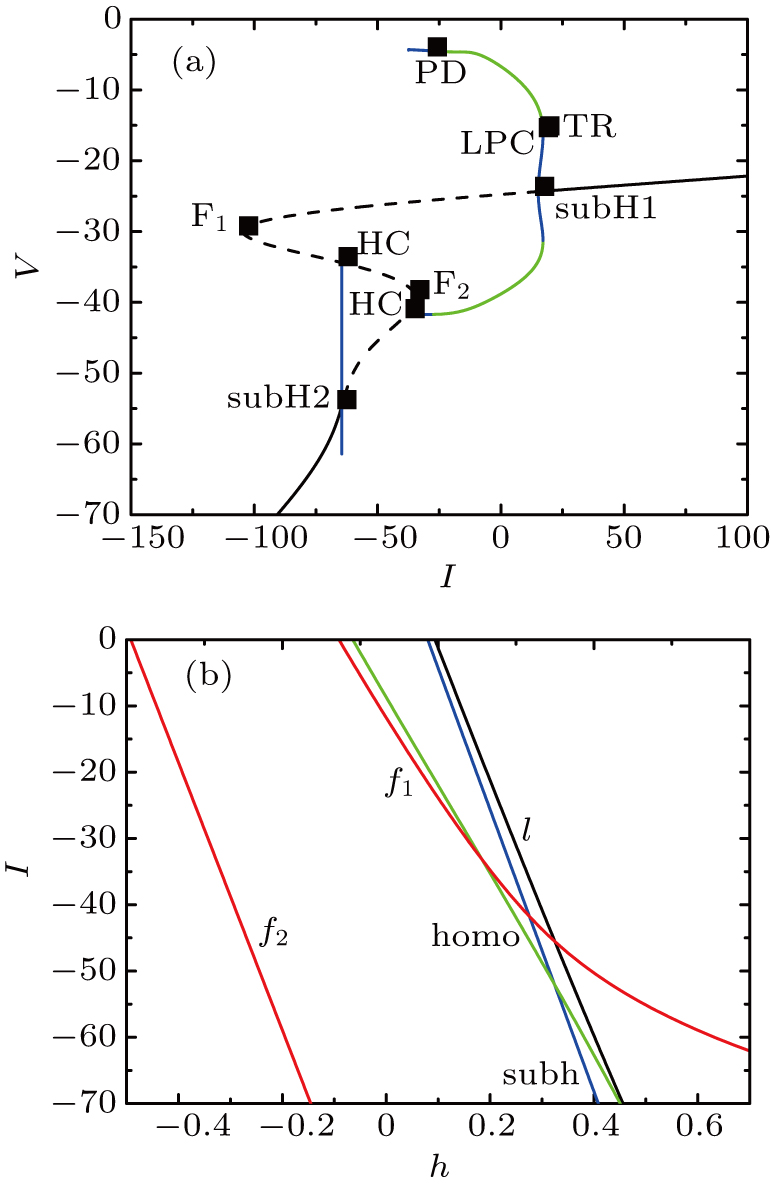
In order to explore the influence of the external forcing current I under the magnetic flux on every MB solution, we firstly focus on the somatic part of each burst. In this section, we set parameter gCAN = 14 nS, k1 = 0.1. The bifurcation diagram of V with respect to the parameter I is given with fixed [Ca] = 0.022 in Fig. 1(a), which is the average value of [Ca] corresponding to the somatic part of every MB pattern. The equilibrium points form an S-shaped curve. The points F1 and F2, which are referred to saddle-node bifurcation of the equilibrium points, separate the S-shaped curve into three branches. The upper branch is composed of focuses which lose their stability through the subcritical Hopf bifurcation (subH1) with the decrease of h. The middle one is composed of saddles. Stable nodes and unstable nodes are on the lower branch, while they are separated by the other subcritical Hopf bifurcation point (subH2). On one hand, a branch of unstable periodic solutions originates from the right subcritical hopf bifurcation (subH1) and becomes stable by going through a fold limit cycle bifurcation point (LPC) which is next to a torus bifurcation point (TR). However, the branch loses stability at a period doubling bifurcation (PD) long before it terminates. On the other hand, the unstable periodic orbits emanate from the other subcritical Hopf bifurcation (subH2) on the lower branch and terminate at a homoclinic bifurcation. Because of the existence of intricate bifurcation structure, the whole system exhibits different firing patterns.[17]

Fig. 1. Fixing [Ca] = 0.022. (a) The bifurcation diagram of V with respect to the parameter I for the somatic subsystem in Eqs. (1)–(4). The black S-shaped curve consists of the stable equilibrium points (the solid curve) and the unstable ones (the dashed curve). The curves which are green and blue represent the stable and unstable periodic orbits, respectively. (b) Two parameter bifurcation diagram of the fast subsystem in Eqs. (1), (2), and (4) with respect to the slow variable h, and the external forcing current I.

At [Ca] = 0.022, the two-parameter bifurcation diagram with respect to the slow variable h and the parameter I is shown in Fig. 1(b). The bifurcation curves include the subcritical Hopf bifurcation (the solid blue curve subh), the fold bifurcation (the solid red curves f1 and f2) of equilibrium points, the homoclinic bifurcation of limit cycle (the solid green curve homo), and the fold limit cycle bifurcation (the solid black curve l). The mechanism about the transition of the firing patterns on the somatic subsystem can be better explained by the two-parameter bifurcation curve of the fast subsystem.

Since the bifurcation structure is more complex when I∈[−55, 0], in the following discussions, we will restrict the range of external forcing current I to the interval [−55, 0]. As I changes, we will numerically simulate the dynamic system and perform a detailed bifurcation analysis for several types of MB.

3.1. Dynamic analysis for mixed bursting with I = 0

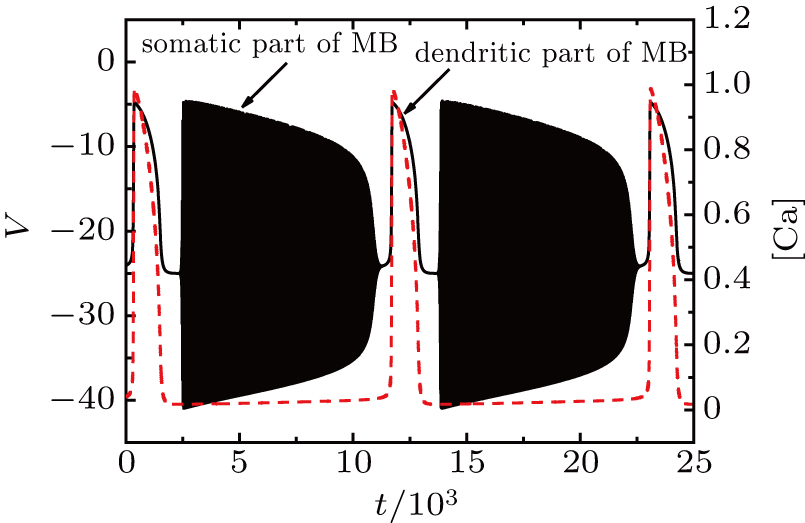
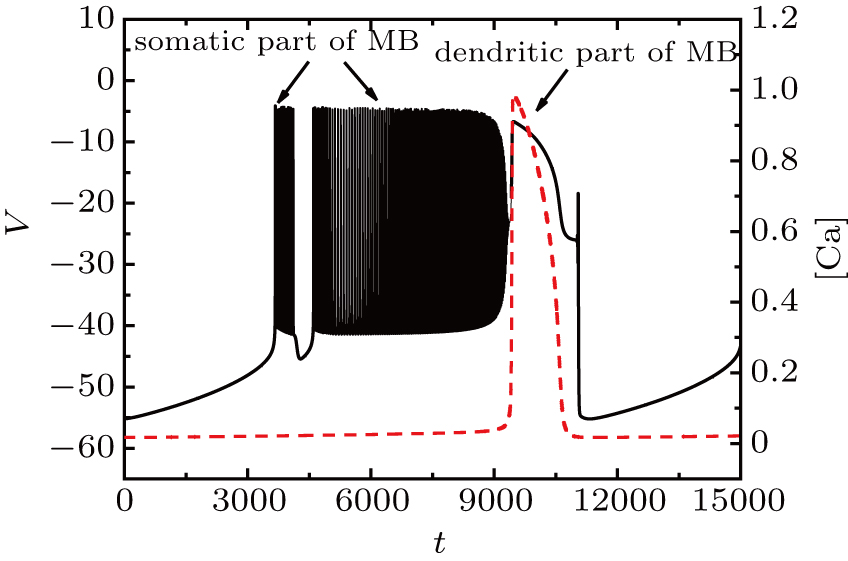
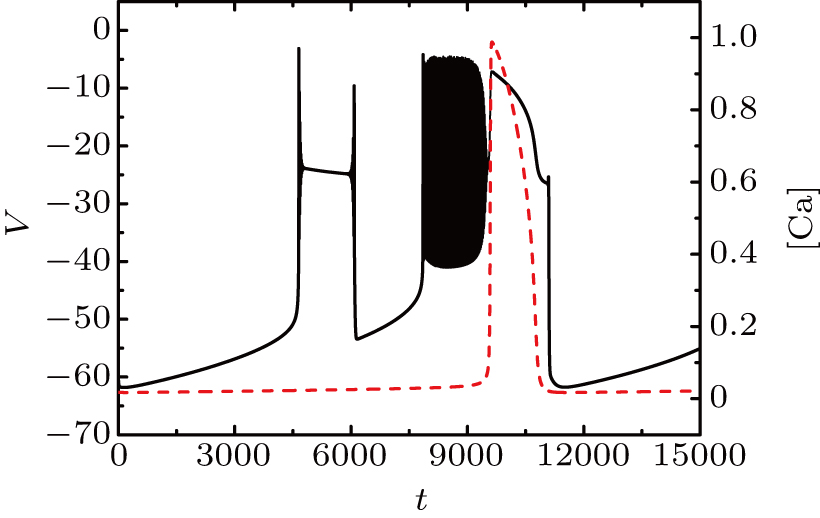
The firing pattern without I is shown in Fig. 2, and the red dashed curve represents the time series of intracellular calcium concentration [Ca]. Meanwhile, we separate an MB burst into two parts: the somatic part of MB that corresponds to the part of extremely slow-varied [Ca] and the dentritic part of MB that corresponds to the sharp increase in [Ca].

Fig. 2. Fixing gCAN = 14 nS, k1 = 0.1, and MB pattern corresponds to I = 0. The values of other parameters are shown in Appendix B. The red dashed curve represents the time series of intracellular calcium concentration [Ca].

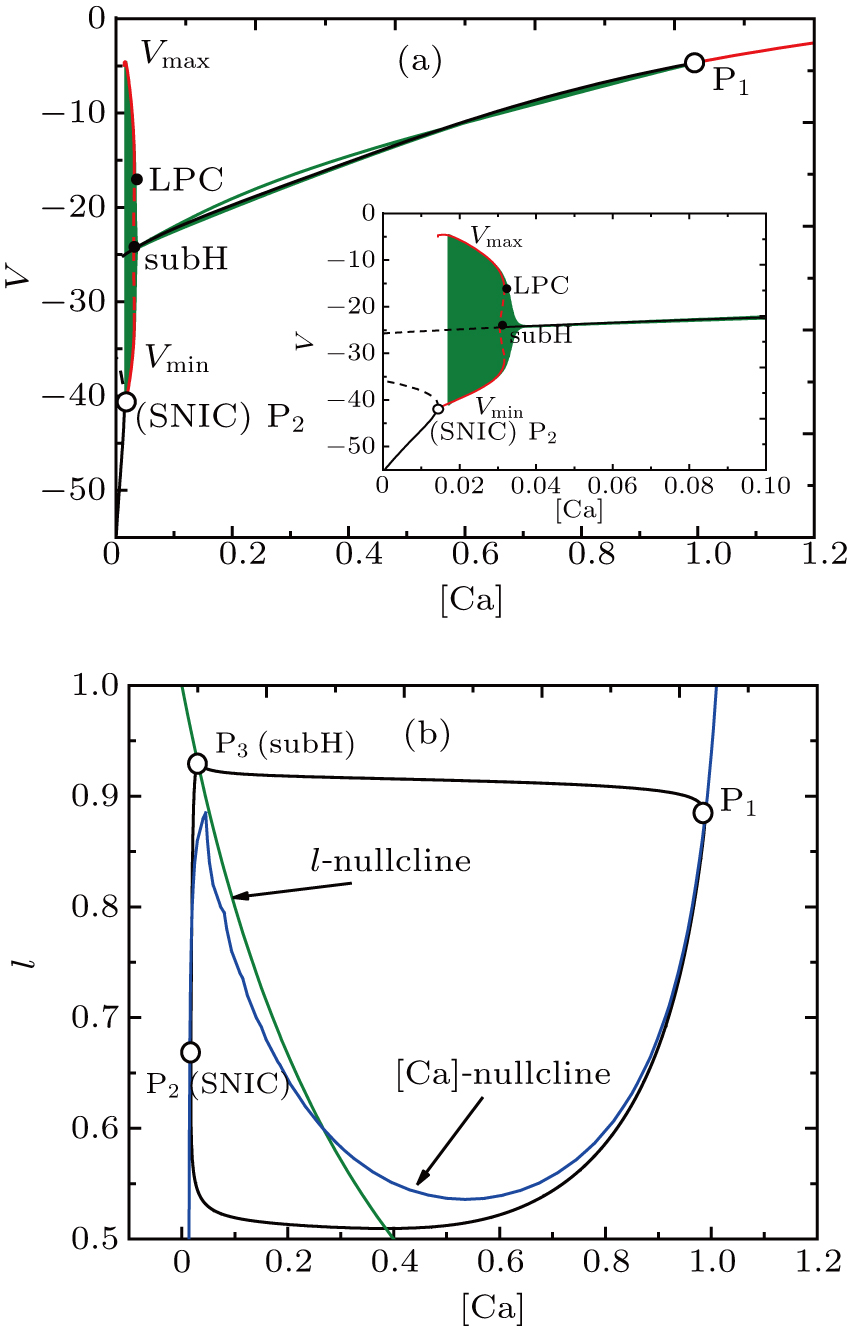
In order to investigate the dynamical mechanism of this MB, we separate the full system into two subsystems, i.e., the fast subsystem in Eqs. (1)–(4) and the slow subsystem in Eqs. (5)–(6). Figure 3(a) shows the bifurcation structure of the fast subsystem in ([Ca], V)-space. The unstable limit cycles which bifurcate from the subcritical Hopf bifurcation point (subH) on the upper branch change to a stable one via fold limit cycle bifurcation (LPC). As [Ca] decreases, the stable limit cycles disappear via a saddle-node bifurcation on an invariant circle (SNIC).

Fig. 3. The generation of full system bursts can be triggered by dendritic relaxation oscillations.[13] (a) Bifurcation diagram of the fast subsystem with bifurcation parameter [Ca]. The solution of the full system when I = 0 (olive) is also superimposed. The bursting arises through a saddle-node on an invariant circle bifurcation and disappears via subcritical Hopf bifurcation. (b) The trajectory in the dendritic subsystem when [IP3] = 0.96. [Ca]-nullcline is the S-shaped curve in blue and l-nullcline is the olive diagonal curve cutting through the figure.

The corresponding periodic orbit in ([Ca], l)-space is shown in Fig. 3(b). Point P1 in each figure denotes the time when the trajectory in the dendritic subsystem jumps up from top knee to the left branch of the [Ca]-nullcline. Once leaving the top knee, the trajectory in the dendritic subsystem jumps to the left branch quickly. Thus we have a rapid decrease of [Ca], and this decrease pushes the trajectory into the branch of periodic orbits. Now [Ca] slowly decreases while the trajectory in ([Ca], l)-space slowly moves along the left branch of the [Ca]-nullcline and finally jumps back to the right branch of [Ca]–nullcline. As long as [Ca] is greater than [Ca]SNIC (P2), the system starts firing. Once [Ca] pasts the subcritical Hopf bifurcation point, the solution stops firing and jumps right to the upper branch of S (Fig. 3(a)). Next, the trajectory in ([Ca], l)-space moves up along the right branch of the [Ca]–nullcline towards its original position, and this completes one cycle of periodic orbit in the dendritic subsystem.

3.2. Dynamic analysis for mixed bursting with nonzero I

In this subsection, we show how the dynamical behaviours of the model vary with the change of I ∈ [−55, −20]. We use fast-slow decomposition and bifurcation analysis to classify each bursting in somatic part of every MB pattern and further reveal the mechanism of MB. When considering the somatic part of MB, we treat h as a slow variable and settle [Ca] as constant. Therefore, equations (1), (2), and (4) form the fast subsystem, and equation (3) is considered as the slow subsystem. A more detailed account of the dynamics analysis is given in the following text.

At I = −20 μA, the full system displays MB while the somatic part exhibits spiking activity, as shown in Fig. 4(a). We show the fast-slow decomposition and bifurcation analysis with [Ca] = 0.02 which corresponds to the mean value of slow-varying [Ca], as shown in Fig. 4(b).
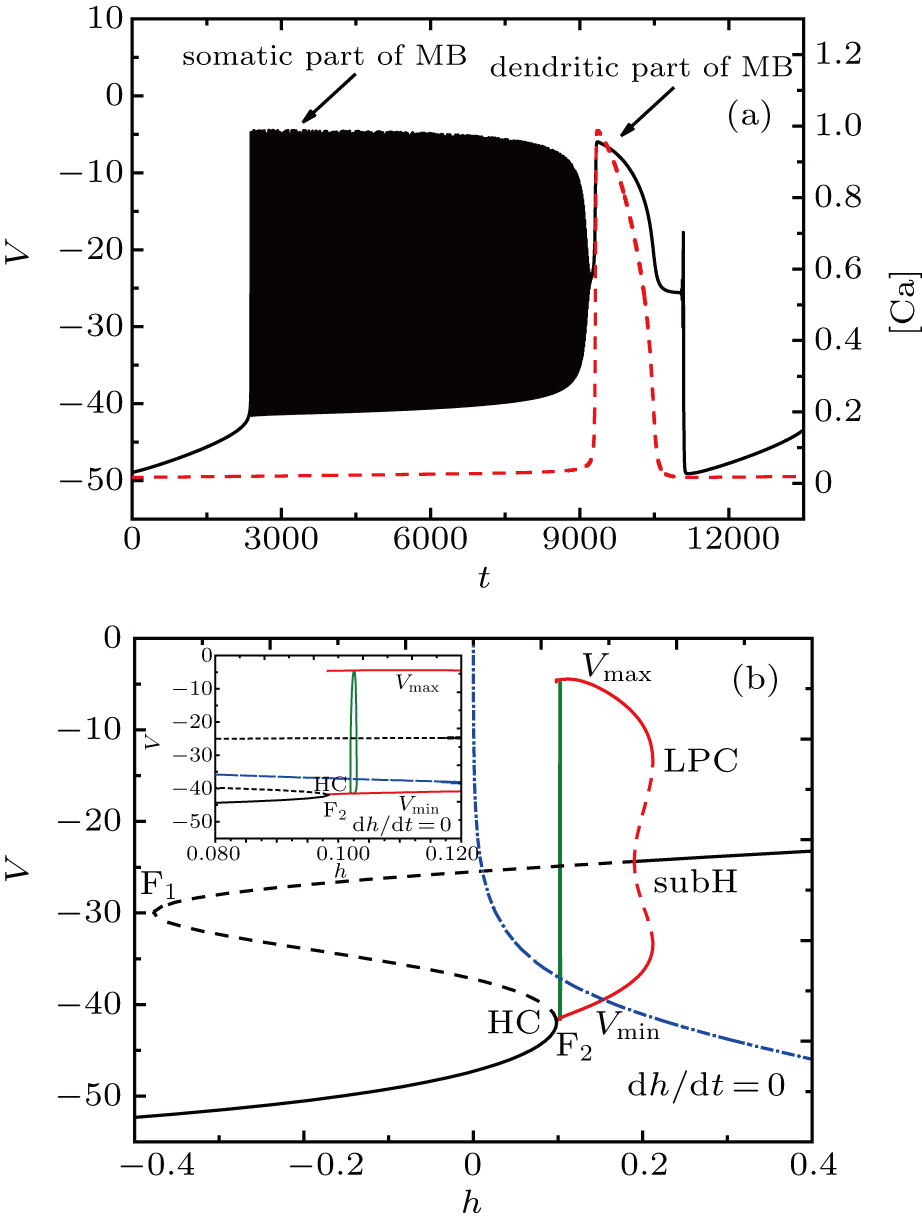
Fig. 4. (a) MB pattern obtained with I = −20 μA and default parameters. (b) Fast-slow decomposition and bifurcation analysis on somatic part of the MB. The somatic part of MB exhibits spiking.

With the decrease of I, the somatic part of MB displays different patterns of bursting. When fixing I = −37 μA, the full system exhibits the MB pattern as shown in Fig. 5. The somatic part contains one burst corresponding to [Ca] = 0.022 and spikes with [Ca] near 0.025. Fast-slow decomposition and bifurcation analysis are selected for their reliability and validity.

Fig. 5. MB pattern obtained with I = −37 μA and default parameters.

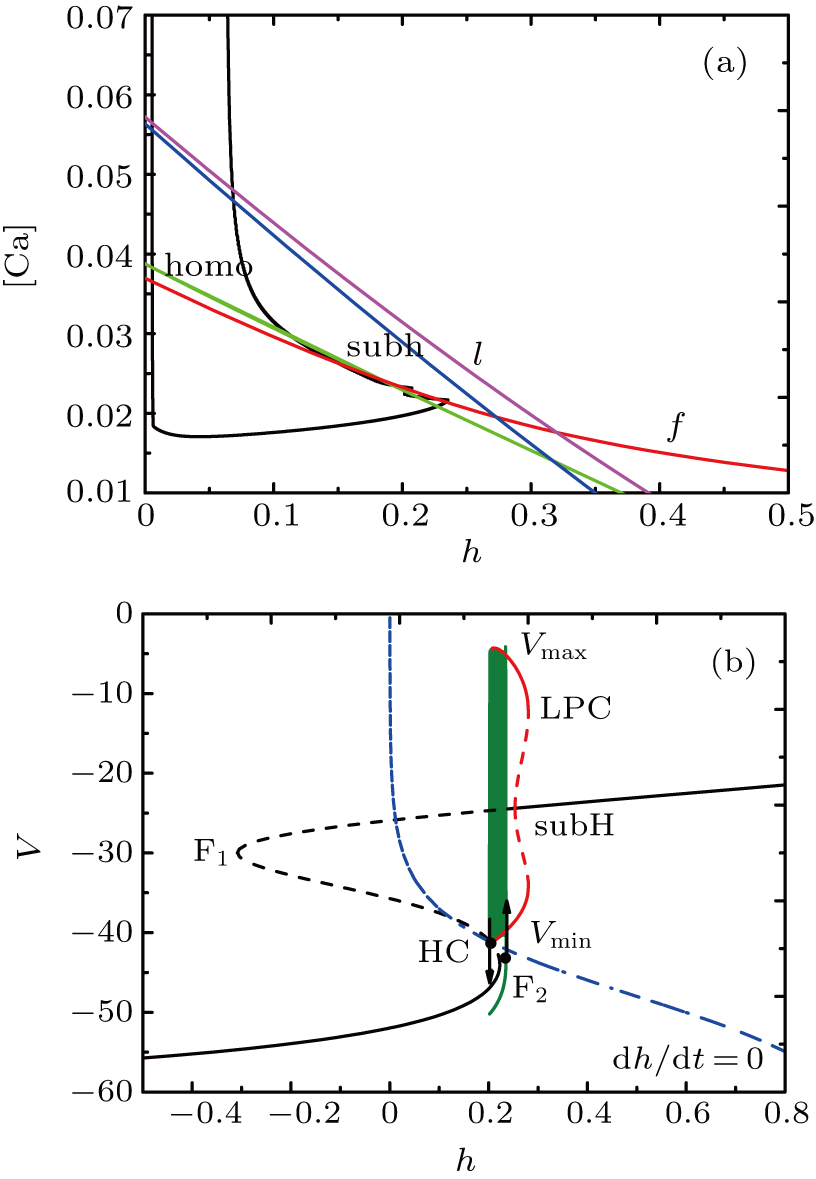
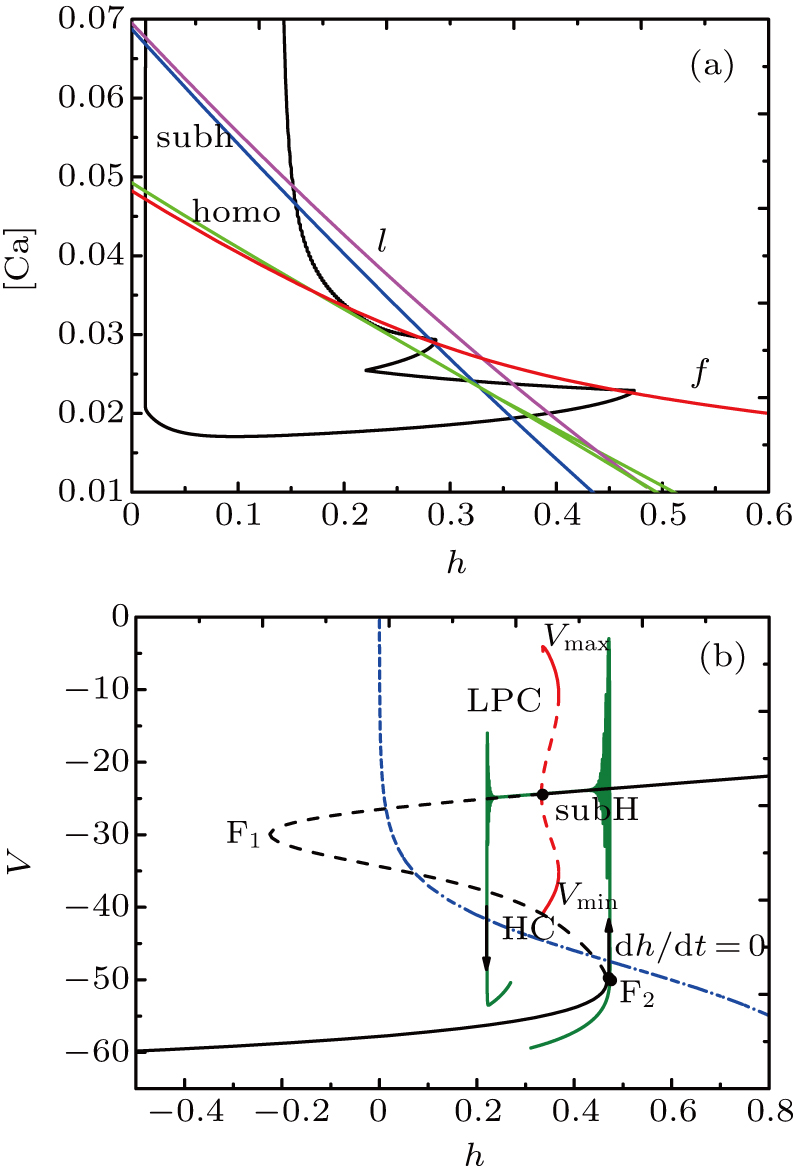
The two-parameter bifurcation diagram is shown in Fig. 6(a). The trajectory of the full system in ([Ca], h) parameter space is also superimposed on the diagram. We attach importance to the trajectory before [Ca] jumps up. The graph shows that the projection of trajectory only crosses back and forth between the fold bifurcation curve and the homoclinic curve, which implies that the burst and spiking in the somatic part of MB are expected to rely on these two bifurcations. The rapid increase of [Ca] ends the somatic part of MB and evokes the dendritic part.

Fig. 6. (a) The two-parameter bifurcation diagram shows the curves of fold bifurcation (the red curve f), homoclinic bifurcation (the green curve homo), subcritical Hopf bifurcation (the blue curve subh), fold bifurcation of limit cycle (the purple curve l), together with projection of the trajectory of the full system (black-colored curve). (b) Fast-slow decomposition and bifurcation analysis on somatic part of the MB. The bursting in somatic part of MB is “fold/homoclinic” bursting.

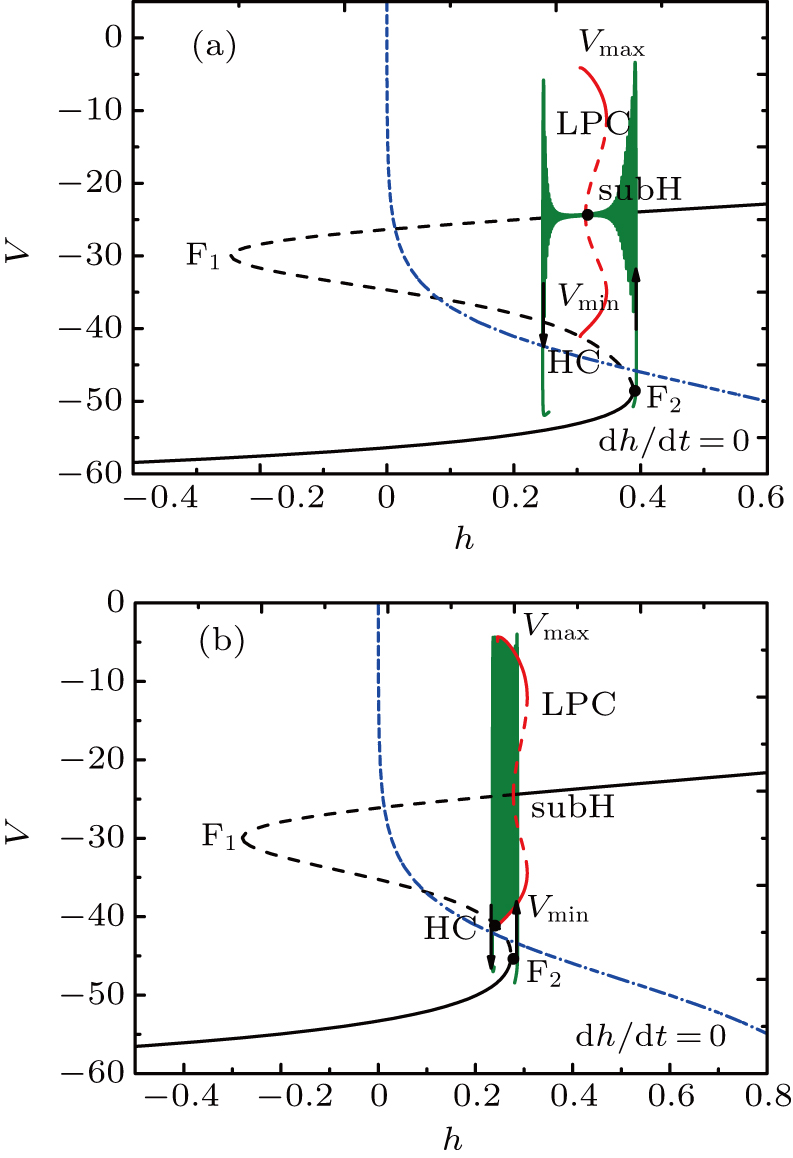
The bifurcation diagram of the fast subsystem in Eqs. (1), (2), and (4) with respect to the slow variable h is performed in (h, V)-plane, as shown in Fig. 6(b). The equilibrium points form an S-shaped curve. The black S-shaped curve consists of stable and unstable focus on the upper branch, unstable saddles on the middle branch, and stable nodes on the lower branch, respectively. After reaching a fold bifurcation of limit cycle fold point (LPC), the unstable limit cycle (red dashed curve) which emanates from the subcritical Hopf point (subH) becomes stable (red solid circle) and eventually disappears at a homoclinic bifurcation point (HC). In this figure, the solid line represents the stable point and the dashed line represents the unstable point. As we can see, the rest state disappears via the fold bifurcation (F2) and the spiking state disappears via the homoclinic bifurcation (HC). Thus the bursting in somatic part is “fold/homoclinic” bursting. The bifurcation analysis of the spiking in somatic part is similar to that shown in Fig. 4(b).

Unlike the earlier case, the somatic part of MB contains spiking and two burstings when I = −42 μA, as shown in Fig. 7(a). Figure 7(b) shows the two-parameter bifurcation diagram, which reveals that the projection of trajectory reaches the fold bifurcation curve three times, corresponding to the existence of the two bursts and the spikes in somatic part of MB.
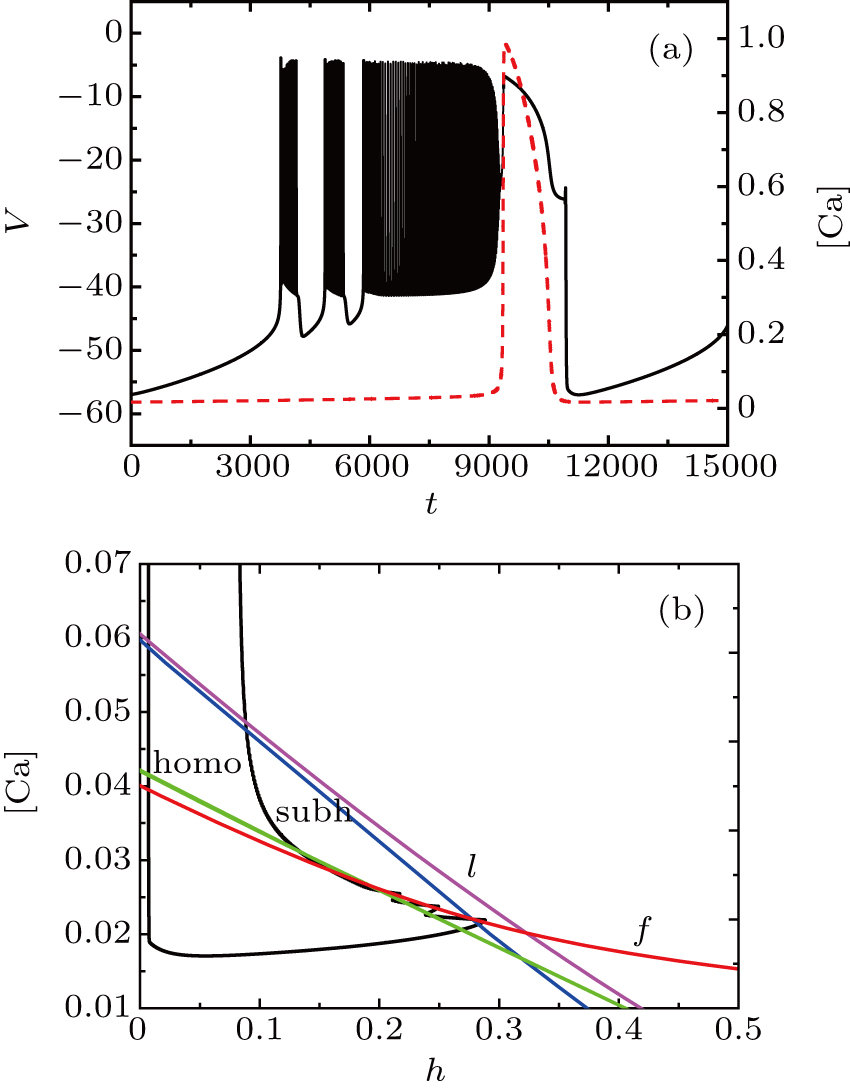
Fig. 7. (a) MB pattern obtained with I = −42 μA and default parameters. (b) The two-parameter bifurcation diagram on the ([Ca], h) parameter space.

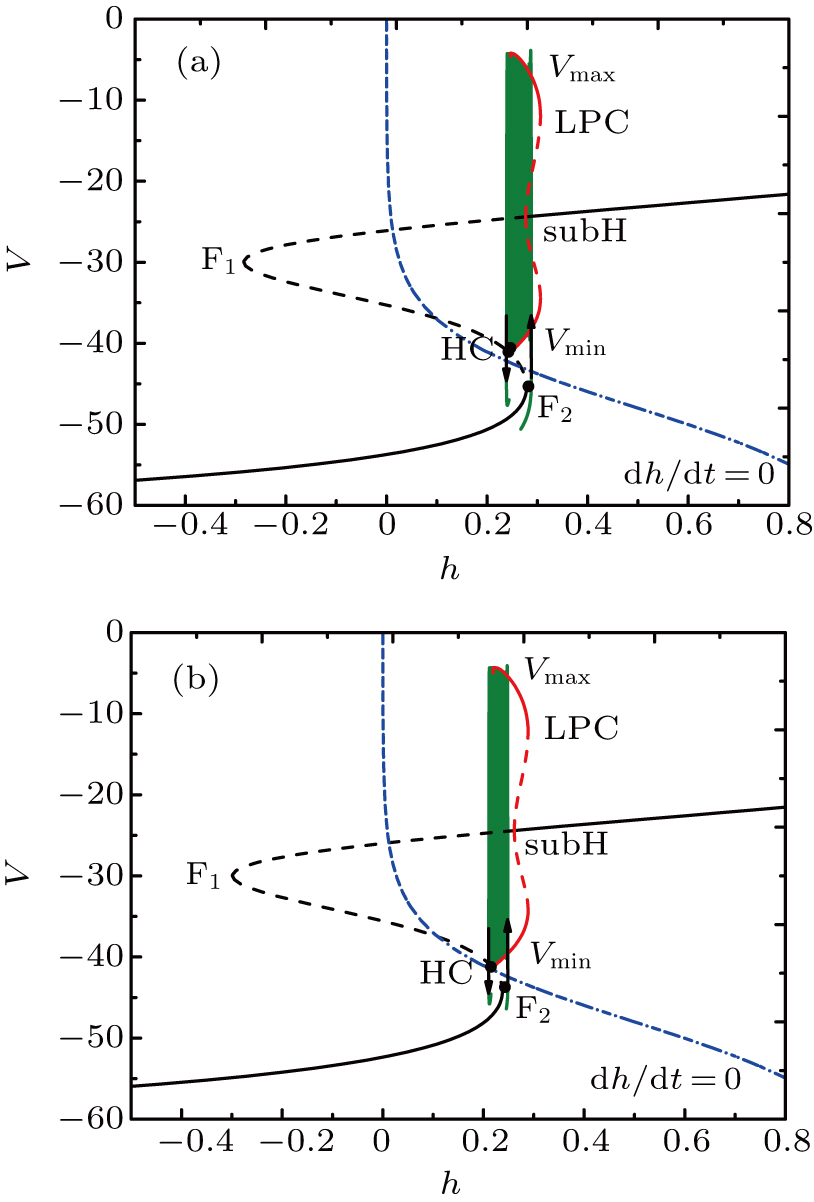
The two bursts in somatic part correspond to [Ca] = 0.022 and [Ca] = 0.024, respectively. Figure 8 shows the superimposing of two bursts to the corresponding one-parameter bifurcation diagram by taking h as a slow variable. We find that the two bursts are of the same type, and they are both “fold/homoclinic” bursting. Also, dynamical mechanism of the spiking in somatic part is similar to that shown in Fig. 4(b).

Fig. 8. Fast-slow decomposition and bifurcation analysis on somatic part of the MB. (a) The first bursting in somatic part of MB is “fold/homoclinic” bursting. (b) The second, “fold/homoclinic” bursting.

If setting I = −48 μA, the full system exhibits the MB pattern as shown in Fig. 9(a). The somatic part of MB also undergoes bursting twice and spiking. Figure 9(b) shows the corresponding two-parameter bifurcation diagram of the (V, n, φ) subsystem with h and [Ca] being bifurcation parameters. Different bifurcation curves traverse the projection of trajectory several times with the gradual increase of [Ca], signifying that bursts in the somatic part of MB may be classified into different types.
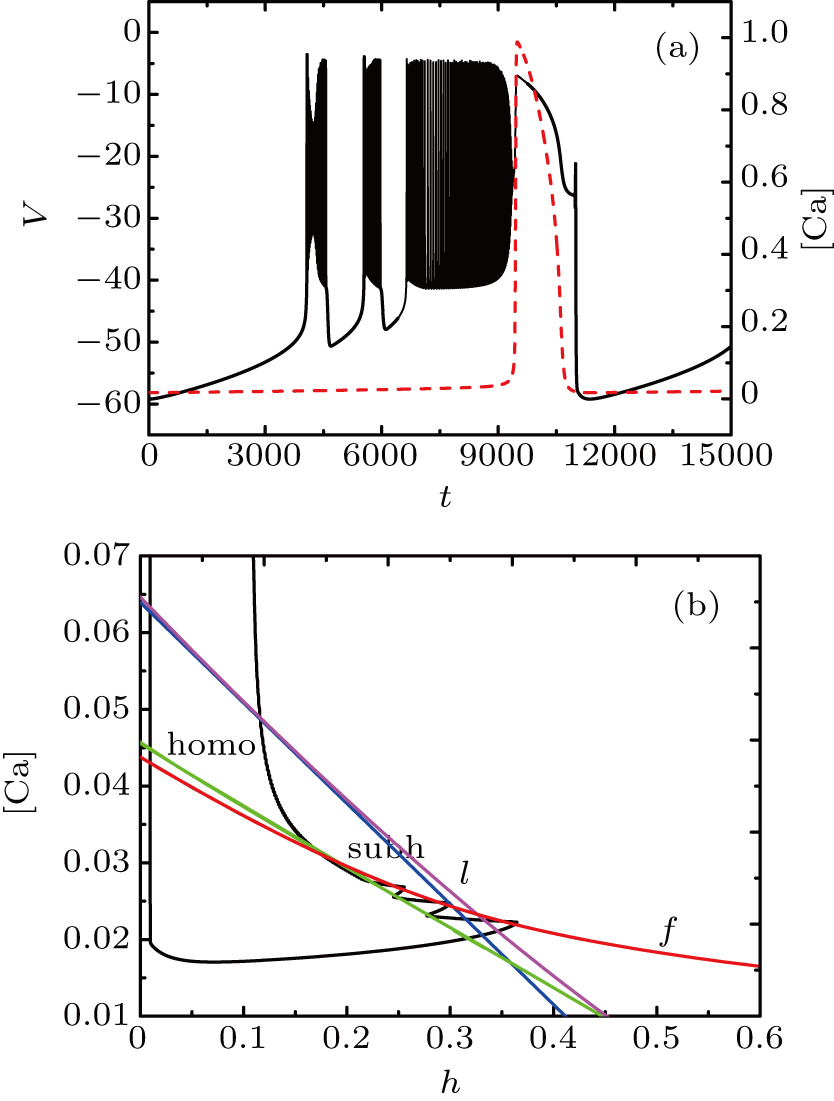
Fig. 9. (a) MB pattern obtained with I = −48 μA and default parameters. (b) The two-parameter bifurcation diagram on the [Ca], h) parameter space.

Although the bifurcation curves in the parameter region are the same as before, they have changed the relative position with the trajectory of the full system. It seems that the bursts in somatic part are related to the fold bifurcation, subhopf bifurcation, fold bifurcation of limit cycle, and the homoclinic bifurcation, while the spiking is near the homoclinic bifurcation. To obtain more information about the somatic part of MB, we consider the one-parameter bifurcation analysis.

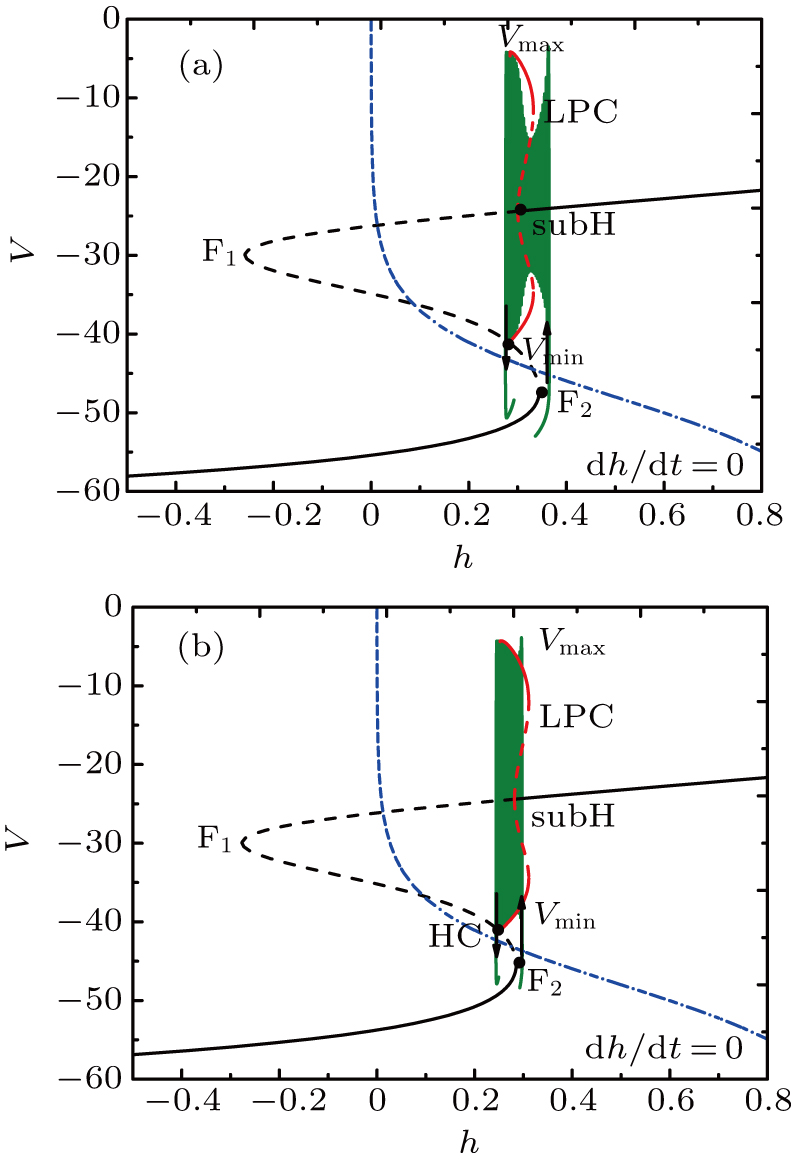
Figure 10 shows the fast-slow decomposition and bifurcation analysis on the somatic part of MB, which implies that the first bursting in somatic part is “subHopf/homoclinic” bursting via “fold/homoclinic” hysteresis loop, while the the second bursting is “fold/homoclinic” bursting. We show the investigation on the first one with [Ca] = 0.022 and the second one with [Ca] = 0.025. As for the spiking in somatic part of MB, its bifurcation analysis is also the same as that in Fig. 4(b).

Fig. 10. Fast-slow decomposition and bifurcation analysis on somatic part of the MB. (a) The first bursting in somatic part of MB is “subHopf/homoclinic” bursting via “fold/homoclinic” hysteresis loop. (b) The second, “fold/homoclinic” bursting.

For fixed I = −50 μA, the full system exhibits the MB pattern as shown in Fig. 11(a). What stands out in this figure is that the two bursts in somatic part of MB are clearly of different types. Figure 11(b) shows the corresponding two-parameter bifurcation diagram of the fast subsystem with h and [Ca] being bifurcation parameters.
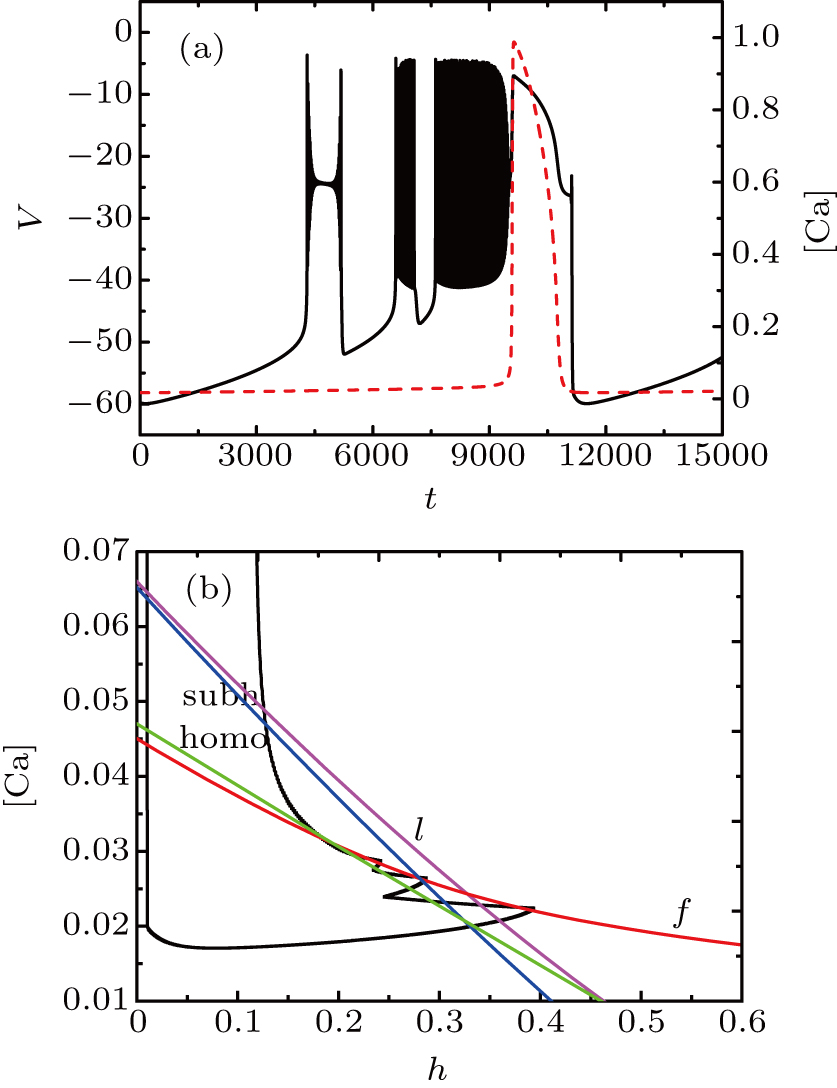
Fig. 11. (a) MB pattern obtained with I = −50 μA and default parameters. (b) The two-parameter bifurcation diagram on the ([Ca], h) parameter space.

While the bifurcation diagram is so similar to that at I = −48 μA, the homoclinic bifurcation curve intersects the first bursting trajectory of the full system at a more right position contrasted with the previous case.

The fast-slow decomposition and bifurcation analysis on the somatic part of MB imply that the first bursting is “subHopf/subHopf” bursting via “fold/homoclinic” hysteresis loop, while the the second bursting is “fold/homoclinic” bursting (see Fig. 12). The two bursts correspond to [Ca] = 0.022 and [Ca] = 0.026 respectively.

Fig. 12. Fast-slow decomposition and bifurcation analysis on somatic part of the MB. (a) The first bursting in somatic part of MB is “subHopf/subHopf” bursting via “fold/homoclinic” hysteresis loop. (b) The second, “fold/homoclinic” bursting.

The spiking in somatic part has no difference with the previous cases. When I decreases to −55 μA, it is interesting that the somatic part of MB contains only one burst again, as shown in Fig. 13. From Fig. 14(a), the two-parameter bifurcation diagram, we can see that all the four bifurcation curves intersect the trajectory at the position of somatic part. The analysis shown in Fig. 14(b) is provided at [Ca] = 0.022, which indicates that the bursting in somatic part is “subHopf/subHopf” bursting via “fold/homoclinic” hysteresis loop. Still, the spiking in somatic part has no difference with the previous cases.

Fig. 13. MB pattern obtained with I = −55 μA and default parameters.
Fig. 14. (a) The two-parameter bifurcation diagram on the ([Ca], h) parameter space. (b) Fast-slow decomposition and bifurcation analysis on somatic part of the MB. The bursting in somatic part is “subHopf/subHopf” bursting via “fold/homoclinic” hysteresis loop.
4. Mixed bursting related to k1

Let us now turn to discuss the influence of magnetic flow effect on the membrane potential of pre-BötC neuron by varying the parameter k1. In this section, we set gCAN = 0.7 nS, I = 0.

Figure 15 shows the corresponding time series of the membrane potential. With the increase of k1, the number of bursting in somatic part gradually increases one by one until k1 = 0.29. When k1 is bigger, starting from the end of somatic part, spiking is generated forwards.
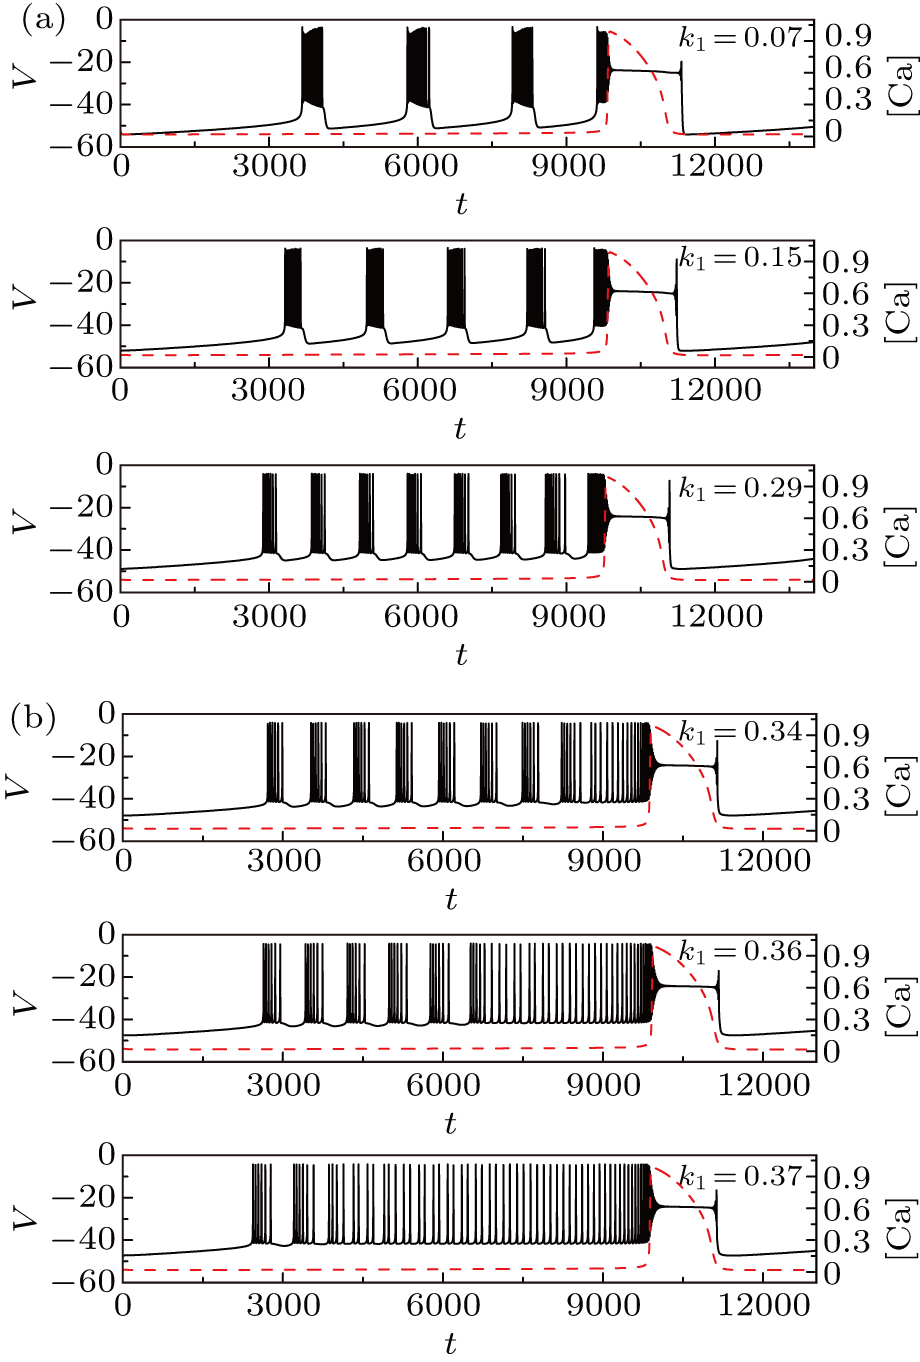
Fig. 15. Time series of the membrane potential of the modified model with different values of k1. The red dashed curve represents the time series of intracellular calcium concentration [Ca].

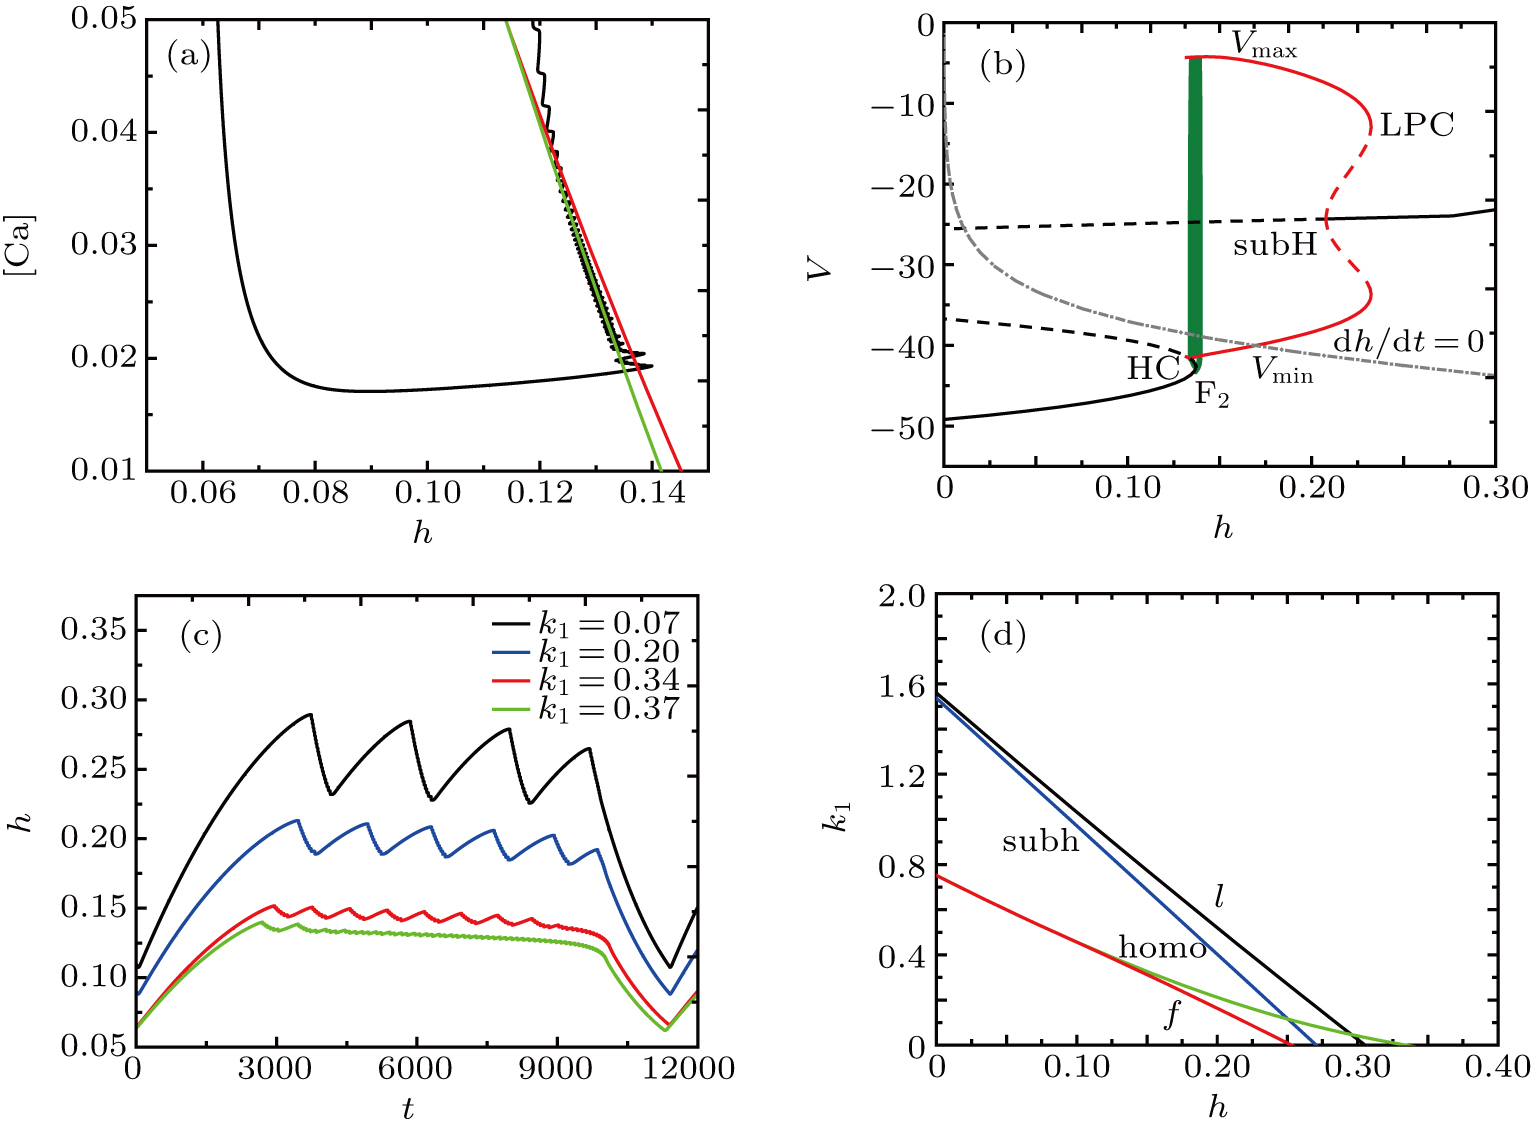
We take the case of k1 = 0.37 as an example to discuss the mechanism of bursting in the somatic part. Figure 16(a) shows its two-parameter bifurcation diagram of the ([Ca], h) subsystem. The trajectory crosses back and forth the homoclinic and fold bifurcation curves twice, which indicates that the two bursts in the somatic part of MB are related to the two bifurcations. Figure 16(b) further confirms that the two bursts are of “fold/homoclinic” type. Moreover, subsequent spiking passes across the homoclinic bifurcation curve all the time until the sudden jump of [Ca] pulls the system out of the somatic part region.

Fig. 16. Dynamics analysis. (a) Two-parameter bifurcation diagram of the ([Ca], h) subsystem when k1 = 0.37, together with projection of the trajectory of the full system (black-colored curve); the curves in the diagram display the fold bifurcation (the red curve f), and the homoclinic bifurcation (the green curve homo) of the fast subsystem in Eqs. (1), (2), and (4). (b) The fast-slow decomposition and bifurcation analysis for the bursting in somatic part of MB with [Ca] = 0.0195 when k1 = 0.37. (c) Time series of slow-parameter h of the modified model with different values of k1. (d) Two-parameter bifurcation diagram of the somatic subsystem.

To explore the mechanism why the frequency (number) of bursting in somatic part increases as k1 increases, we show the two-parameter bifurcation diagram of the somatic subsystem in Fig. 16(d). What is striking in this figure is that the distance between the homoclinic and fold bifurcation curves becomes smaller as h decreases (figure 16(c) shows that h decreases as parameter k1 increases). This regularity has also been used by other researchers to explain the increased frequency of “fold/homoclinic” bursting.[11,15]

5. Conclusion and discussion

The effect of magnetic flux and external current on dynamical behaviors of the pre-BötC neuron model has not been considered previously. In this paper, by adding the terms of magnetic flux and direct currents to a single-compartment pre-BötC neuron model, we aim to assess how the two factors influence the mixed bursting of the system. Numerical simulations have revealed that under nonzero magnetic flux, the variation of the direct current I leads to the conversion of mixed bursting from one type to another. On the other hand, if setting I = 0, the change of feedback coefficient k1 related to magnetic flux leads to the change of the frequency of somatic part of mixed bursting. We have also explored the dynamical mechanism of different mixed burstings. The fast-slow decomposition and two-parameter bifurcation analysis are the main methods we have adopted. Our results help to better understand the dynamic properties of pre-BötC system containing magnetic flux and external current terms. Also, the analysis may broaden our understanding of the mixed bursting.

Reference
[1] Smith J C Ellenberger H H Ballanyi K Richter D W Feldman J L 1991 Science 254 726
[2] Feldman J L Negro C A D Gray P A 2013 Annu. Rev. Physiol. 75 423
[3] Kam K Worrell J W Janczewski W A Cui Y Feldman J L 2013 J. Neurosci. 33 9235
[4] Lieske S P Thoby-Brisson M Telgkamp P Ramirez J M 2000 Nat. Neurosci. 3 600
[5] Ruangkittisakul A Schwarzacher S W Secchia L Ma Y Bobocea N Poon B Y Funk G D Ballanyi K 2008 J. Neurosci. 28 2447
[6] Caughey J L J 1943 Am. Rev. Tuberc. 48 382
[7] Li P Janczewski W A Yackle K Kam K Pagliardini S Krasnow M A Feldman J L 2016 Nature 530 293
[8] Butera R J Rinzel J Smith J C 1999 J. Neurophysiol. 82 382
[9] Butera R J Rinzel J Smith J C 1999 J. Neurophysiol. 82 398
[10] Best J Borisyuk A Rubin J Terman D Wechselberger M 2005 SIAM J. Appl. Dyn. Syst. 4 1107
[11] Duan L X Zhai D H Tang X H 2012 Int. J. Bifurcation and Chaos 22 1250114
[12] Li Y X Rinzel J 1994 J. Theor. Biol. 166 461
[13] Toporikova N Butera R J 2011 J. Comput. Neurosci. 30 515
[14] Park C Rubin J E 2013 J. Comput. Neurosci. 34 345
[15] Dunmyre J R Negro C A D Rubin J E 2011 J. Comput. Neurosci. 31 305
[16] Wang Y Y Rubin J E 2016 J. Comput. Neurosci. 41 245
[17] Z S Chen L N Duan L X 2019 Appl. Math. Model. 67 234
[18] Li J J Wu Y Du M M Liu W M 2015 Acta Phys. Sin. 64 030503 in Chinese
[19] Lv M Ma J 2016 Neurocomputing 205 375
[20] Lv M Wang C N Ren G D Ma J Song X L 2016 Nonlinear Dyn. 85 1479
[21] Zhan F B Liu S Q 2017 Front. Comput. Neurosci. 11 00107
[22] Duan L X Cao Q Y Wang Z J Su J Z 2018 Nonlinear Dyn. 94 1961
[23] Cao B Guan L N Gu H G 2018 Acta Phys. Sin. 67 240502 in Chinese
[24] Ermentrout B 2002 Simulating, Analyzing, and Animating Dynamical Systems: a Guide to XPPAUT for Researchers and Students 1 Philadelphia SIAM
[25] Bao B C Liu Z Xu J P 2010 Electron. Lett. 46 228
[26] Muthuswamy B 2010 Int. J. Bifurcation and Chaos 20 1335
[27] Li Q D Zeng H Z Li J 2015 Nonlinear Dyn. 79 2295