The determinant factors for map resolutions obtained using CryoEM single particle imaging method
Project supported by the National Natural Science Foundation of China (Grant Nos. 11774011, 11434001, U1530401, and U1430237).
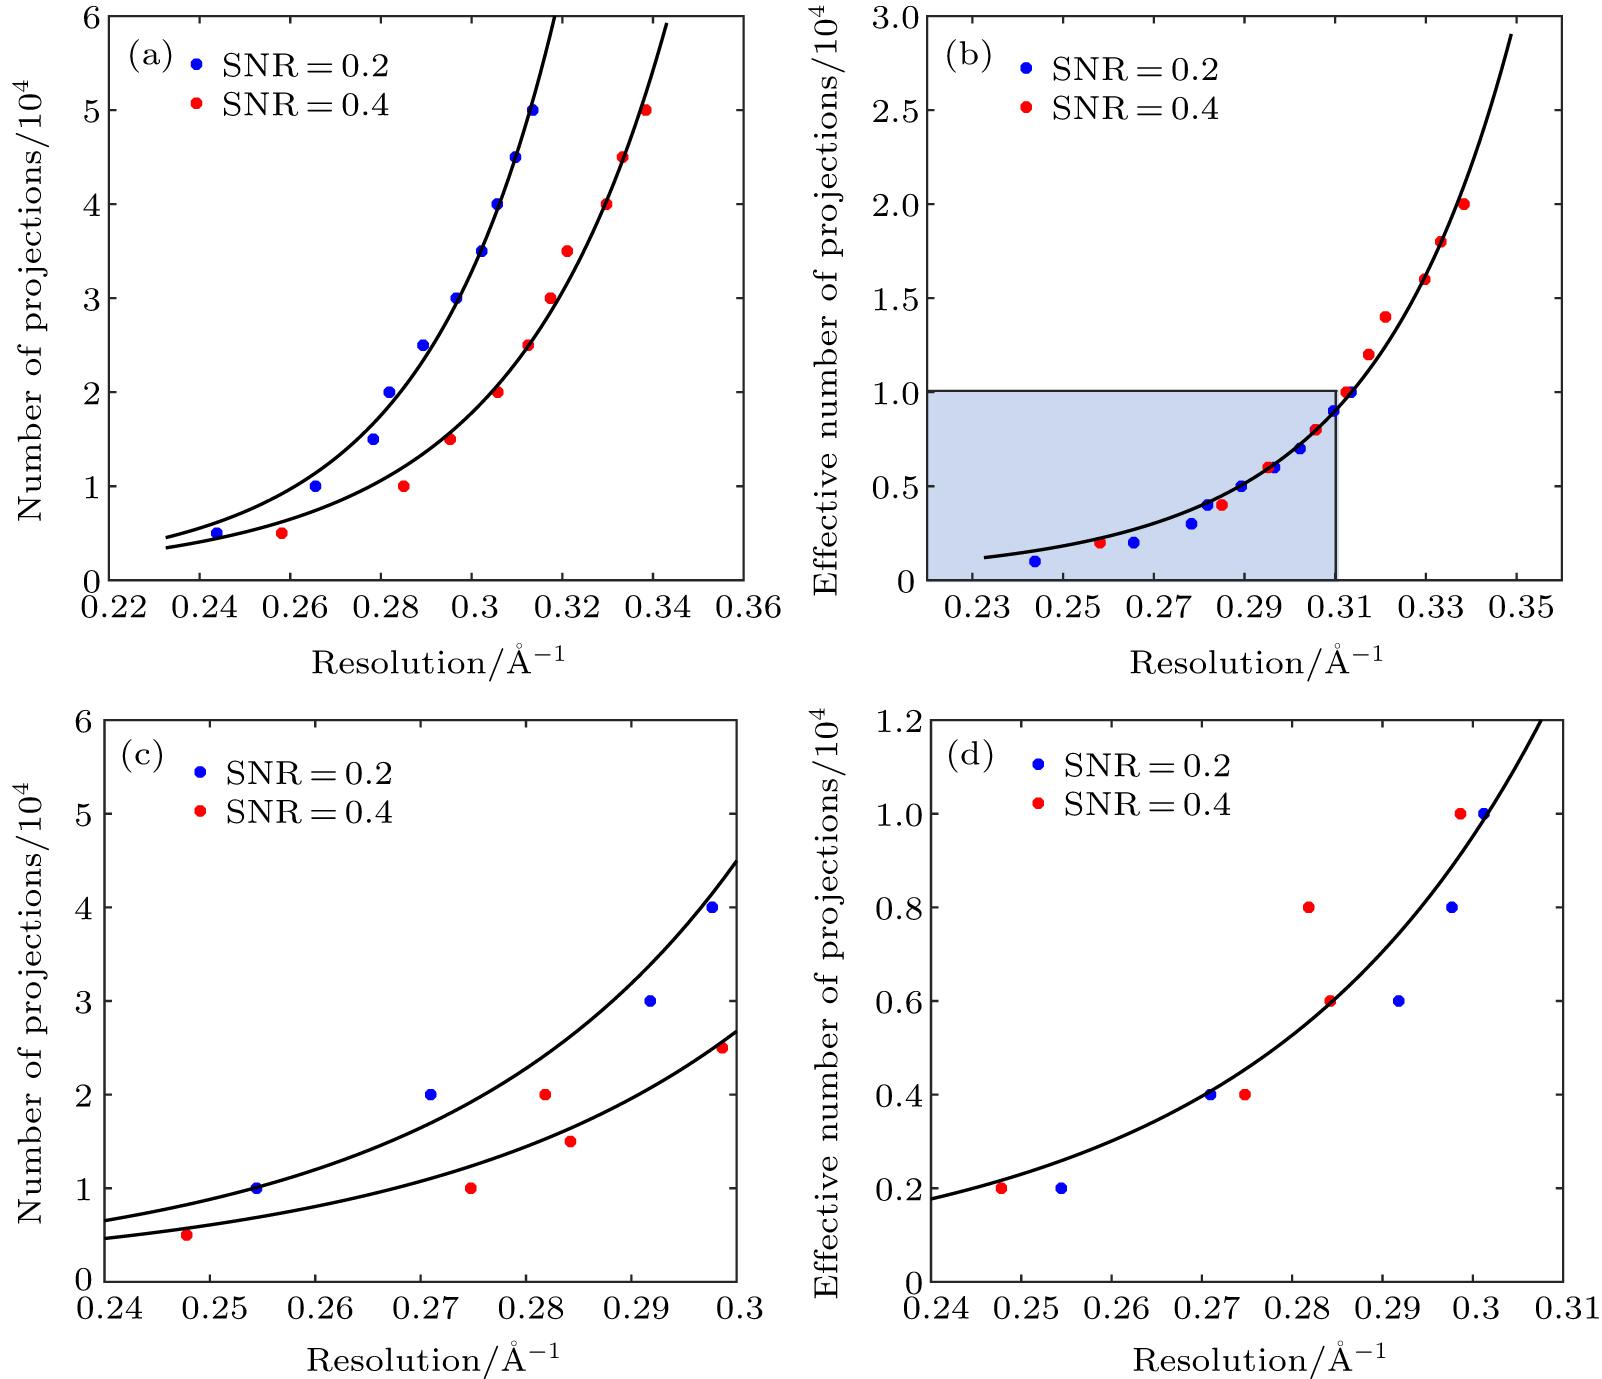
(color online) Relation between model resolution and data quantity/quality. (a) The model resolution depends on the number of measurements. Two sets of data are plotted with signal to noise ratios (SNR) of 0.2 and 0.4. The lines were obtained by fitting the data points using the Gaussian noise model. R-square values were 0.9946 and 0.9865, respectively. (b) The noise term was combined with the number of projections. The two sets of data in Fig.
