Influence of characteristics’ measurement sequence on total ionizing dose effect in PDSOI nMOSFET
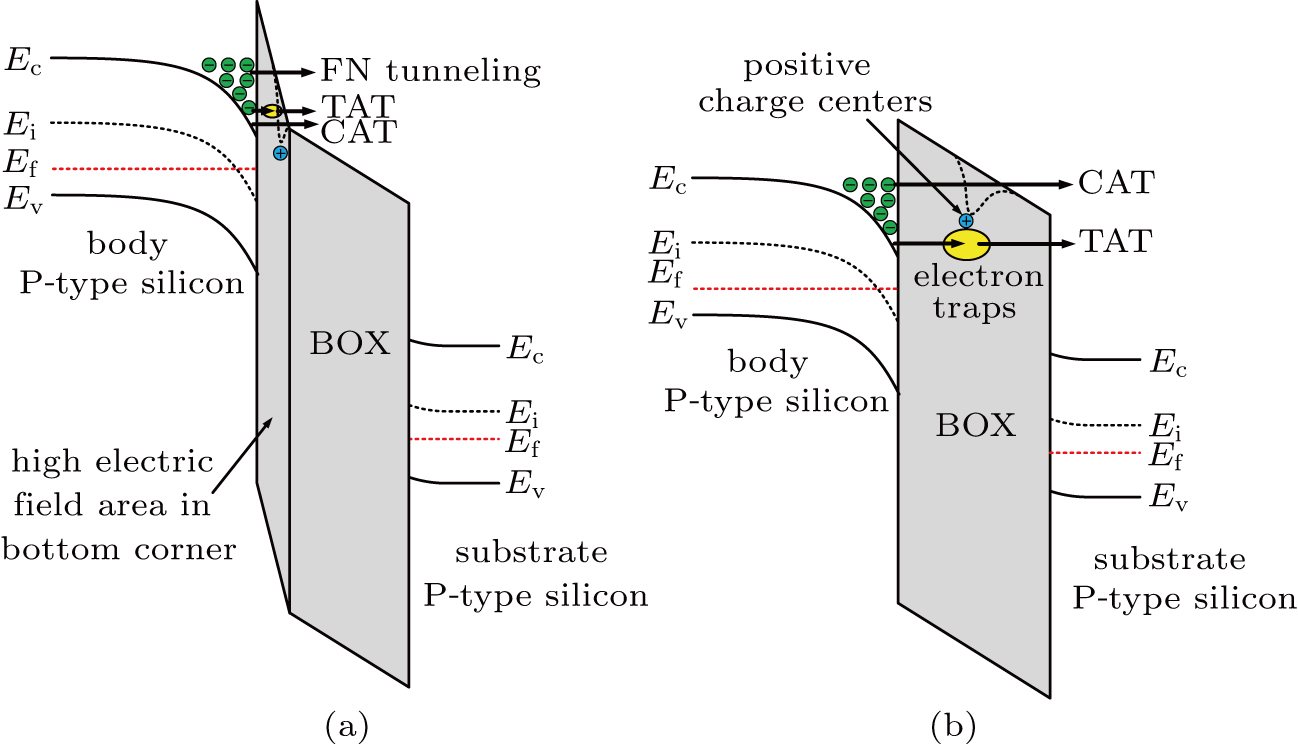
(color online) Energy band diagrams of PDSOI nMOSFETs, respectively, (a) at the bottom corner of STI and (b) in the BOX. TAT is trap-assisted tunneling. CAT is positive charge-assisted tunneling. Yellow region is electron trap. Blue circles are positive charge centers.
