Large magnetic moment at sheared ends of single-walled carbon nanotubes
Zhang Jian1, 4, Deng Ya1, 4, Hao Ting-Ting2, Hu Xiao1, 4, Liu Ya-Yun1, 4, Peng Zhi-Sheng3, Nshimiyimana Jean Pierre1, 4, Chi Xian-Nian1, 4, Wu Pei1, 4, Liu Si-Yu3, Zhang Zhong1, Li Jun-Jie2, Wang Gong-Tang3, ‡, Chu Wei-Guo1, §, Gu Chang-Zhi2, Sun Lian-Feng1, ¶
CAS Key Laboratory of Nanosystem and Hierarchical Fabrication, CAS Center for Excellence in Nanoscience, National Center for Nanoscience and Technology, Beijing 100190, China
Institute of Physics, Chinese Academy of Sciences (CAS), Beijing 100190, China
School of Physics and Electronics, Shandong Normal University, Jinan 250014, China
University of Chinese Academy of Sciences, Beijing 100190, China


† Corresponding author. E-mail: wanggt@sdnu.edu.cn wgchu@nanoctr.cn slf@nanoctr.cn

Project supported by the National Key Research and Development Program of China (Grant Nos. 2018YFA0208403 and 2016YFA0200403), the National Natural Science Foundation of China (Grant Nos. 51472057, 11874129, 91323304, and 11674387), the Strategic Priority Research Program of the Chinese Academy of Sciences (Grant No. XDA09040101), and the Baotou Rare Earth Research and Development Centre, Chinese Academy of Sciences (Grant No. GZR 2018001).

Abstract

In this work we report that after single-walled carbon nanotubes (SWNTs) are sheared with a pair of titanium scissors, the magnetization becomes larger than that of the corresponding pristine ones. The magnetization increases proportionally with the number of SWNTs with sheared ends, suggesting that there exist magnetic moments at the sheared ends of SWNTs. By using the coefficient of this linear relation, the average magnetic moment is estimated to be 41.5 ± 9.8 μB (Bohr magneton) per carbon atom in the edge state at temperature of 300.0 K, suggesting that ultrahigh magnetic fields can be produced. The dangling sigma and pi bonds of the carbon atoms at sheared ends play important roles in determining the unexpectedly high magnetic moments, which may have great potential applications.

1. Introduction

Ultrahigh magnetic fields play an important role in condensed matter physics,[17] chemistry,[8] materials science,[9,10] and biosciences.[11,12] In the laboratory, they are usually produced by very large currents flowing through superconducting, resistive or hybrid magnets, which requires the extreme conditions (low temperature, huge cooling water and tens of megawatts of power) and thus restricting their applications.[13] As a matter of fact, magnetic fields can also be produced with magnetic materials,[14,15] which have the advantages of higher working temperature and low energy consumption. However, the highest previously reported magnetic field produced with magnetic materials was about 2.5 Tesla, which is much lower than ultrahigh magnetic fields usually needed.[112] In this work, we report that single-walled carbon nanotubes (SWNTs) start to oxidize at 312 °C in dry air after they are sheared. This oxidation temperature is much lower than that of amorphous carbon (∼411 °C) and that of pristine SWNTs (∼633 °C). Meanwhile, by measuring the magnetizations of pristine SWNTs samples, the corresponding treated ones and the percentage of SWNTs with sheared ends in the SWNTs samples, the magnetic moments at the sheared ends of SWNTs are quantified using SQUID and PPMS. At a temperature of 300.0 K, if edge states with a width of 1 nm are formed due to relaxation and reconstruction at the sheared ends of SWNTs, then the average magnetic moment is estimated to be 41.5 ± 9.8 μB per carbon atom in the edge states, suggesting that ultrahigh magnetic field can be produced. The dangling sigma and pi bonds of carbon atoms at the sheared edges of SWNTs play important roles in determining the unexpectedly high magnetic moments and ultrahigh magnetic fields.

2. Experimental section

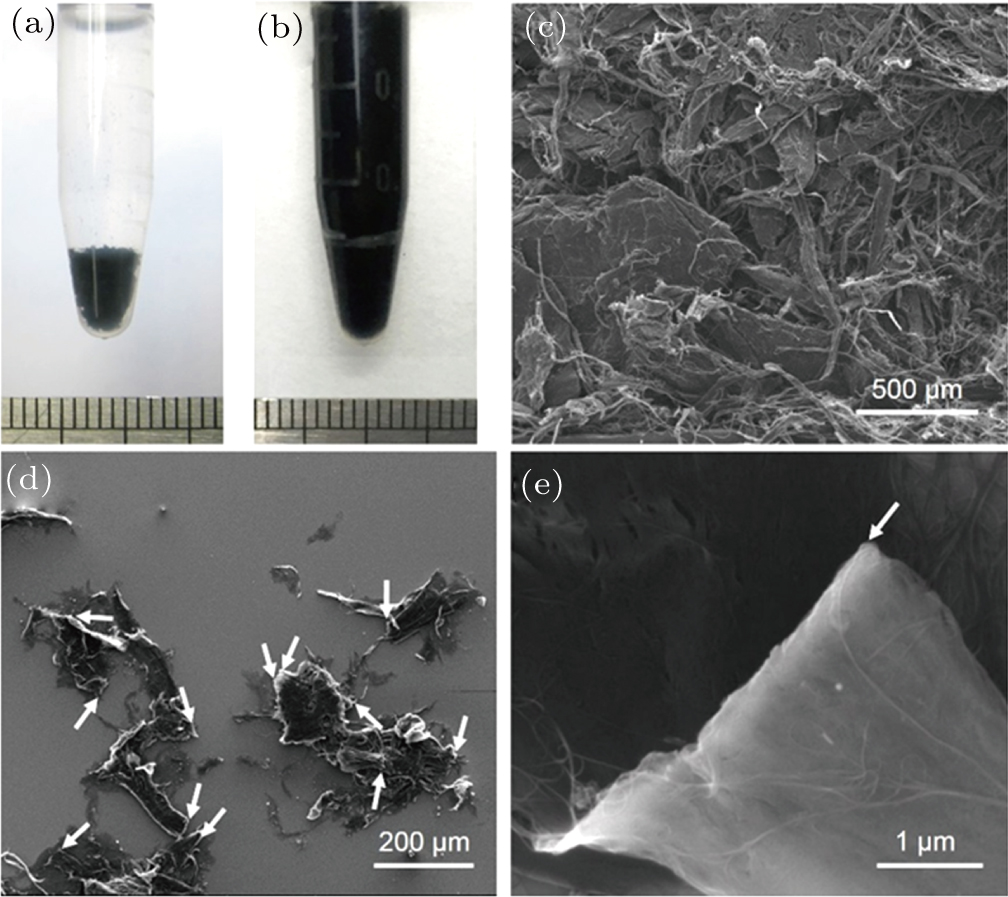
The SWNTs used in this work were grown by floating catalytic chemical vapor deposition and were supplied by Chengdu Organic Chemicals Co. Ltd., Chinese Academy of Sciences. The SWNTs appeared as black powers in bulk with a high weight purity of about 97.5%, the diameter and length of individual SWNTs of about 1.5 nm∼ 2.0 nm and 20 ± 5 μm, respectively (see Supplementary Material, Fig. S1(1). The individual SWNTs usually form bundles with quite a wide distribution in diameter and length as seen from SEM images (Fig. 1). After the weight of a pristine SWNT sample is measured, the SWNT sample is transferred into a centrifuge tube, which is filled with some amount of ethanol (Fig. 1(a)). Then, the SWNTs are sheared manually inside the centrifuge tube by using a pair of titanium scissors for ophthalmic operations under an optical microscope. The shearing frequency is about 60 times/minute. After shearing treatment for 10 min–20 min, the SWNTs usually fill the centrifuge tube, as can be seen in Fig. 1(b). This suggests that the SWNT bundles become shorter during the shearing treatment. This can be confirmed with SEM characterization (Fig. 1(d)), showing that the SWNTs become smaller pieces after being sheared. For SWNT bundles with small diameter, the shearing plane is usually neat, straight and perpendicular to the axis of the SWNT bundle, as shown by the arrow in Fig. 1(e). Typical Raman spectra from a sheared end and from the rest of the bundle are shown in Supplementary Material, Fig. S1(2). The ID/IG intensity ratio at the sheared end is found to be 0.072, which is larger than that at the middle part of the bundle (0.028). This suggests that a much higher proportion of defects appears at the sheared ends of the SWNT bundle.

Fig. 1. Preparing and shearing of SWNTs samples. (a) Typical optical image of a pristine, purified SWNTs (∼ 3 mg) in centrifuge tube with ethanol as solvent. (b) Optical image of SWNTs in centrifuge tube after being treated by shearing. Although sample weight remains the same, solutions look different, suggesting that SWNTs bundles have smaller dimensions after being treated. (c) Typical SEM image of pristine, purified SWNTs, showing that SWNTs are in the form of bundles. Diameter and length of SWNT bundles each have quite a wide distribution. (d) SEM image of SWNTs after being treated by shearing. SWNTs have become smaller pieces, which still show wide size distribution. Arrows indicate shearing plane of SWNT bundles. (e) SEM image of SWNT bundle with diameter about 4 μm. Shearing plane is neat, straight and perpendicular to SWNT bundle as shown by arrow.
3. Results and discussion

After shearing treatment, the lengths of SWNT bundles are still longer than those of their component individual SWNTs (∼ 20 μm) (Fig. 1(d)). This suggests that the SWNTs at locations more than 20 μm away from the shearing planes are not affected. For SWNTs at or near the shearing planes, the possibility of pulling out of individual SWNTs from SWNT bundles cannot be excluded during the shearing treatment. However, the SWNTs at the shearing plane are believed to be sheared instead of pulling out from the SWNT bundle due to the following reasons. First, the morphologies of the sheared edges are different for the pulling out or shearing of SWNTs. When a rope of SWNTs is broken under a tensile stress, the broken planes show irregular edges and some individual SWNTs (or bundles with smaller diameters) protrude from the edges (Supplementary Material, Fig. S2). This indicates that under the tensile stress, the breaking occurs when some SWNTs are pulled out from longer SWNTs bundles due to the excellent mechanical properties of individual nanotubes.[16] In contrast, when SWNTs are sheared with a pair of scissors, many sheared edges can be observed, which are usually neat and straight (Fig. 1(d)). For the SWNT bundles with smaller diameter, the shearing edges are almost perpendicular to the axis of the SWNT bundles as shown by the arrows (Figs. 1(d) and 1(e)). Second, the carbon nanotubes can be readily sheared with the titanium scissors used in this work. Because the length of individual SWNTs used in work is about 20 μm, the newly obtained sheared ends of SWNTs are mixed with those pristine ends of SWNTs. This makes the studies of the structure of sheared ends of SWNTs difficult and challenging. To resolve this difficulty, a bundle of multiwalled carbon nanotubes (MWNTs) with a length of about 1 mm is used for the shearing experiments and sheared with the titanium scissors. The breaking structures of individual nanotubes are studied with high resolution transmission electron microscope (HRTEM). The results indicate that a section of MWNTs can be readily sheared from a longer bundle of MWNTs (see Supplementary Material, Fig. S3). Although individual nanotube in the bundle is somewhat curved and is not perfectly aligned, the shearing plane of individual nanotube is usually perpendicular to the axis of the individual MWNT. Images of the breaking ends of MWNTs by HRTEM indicate that nearly all the outer and inner walls of individual MWNTs can be sheared in nearly the same locations (Supplementary Material, Fig. S3). This confirms the conclusion that the shearing planes are almost perpendicular to the axis of each individual MWNTs under shearing stress. This phenomenon is quite different from the breaking structure of an individual MWNT under tensile stress, where only the outermost wall breaks.[17] These observations are believed to be applicable to SWNTs due to their similar structures and mechanical properties.[16,17]

These results indicate that after experiencing the shearing treatment, the SWNTs in the SWNT sample can be classified into two types: SWNTs unaffected and SWNTs sheared successfully. For SWNTs that are successfully sheared, there are sheared ends in SWNTs. For these SWNTs with sheared ends, the carbon atoms at the edge sites have only two neighboring carbon atoms,[18] in contrast to other carbon atoms that bond to three neighboring carbon atoms. The dangling bonds (sigma and pi) of the carbon atoms at the edges may result in some new, novel properties. As shown later, the oxidation of the SWNTs with sheared ends starts at temperature as low as 312 °C, by which the percentage of SWNTs that have been sheared in the shear-treated SWNT sample can be estimated.

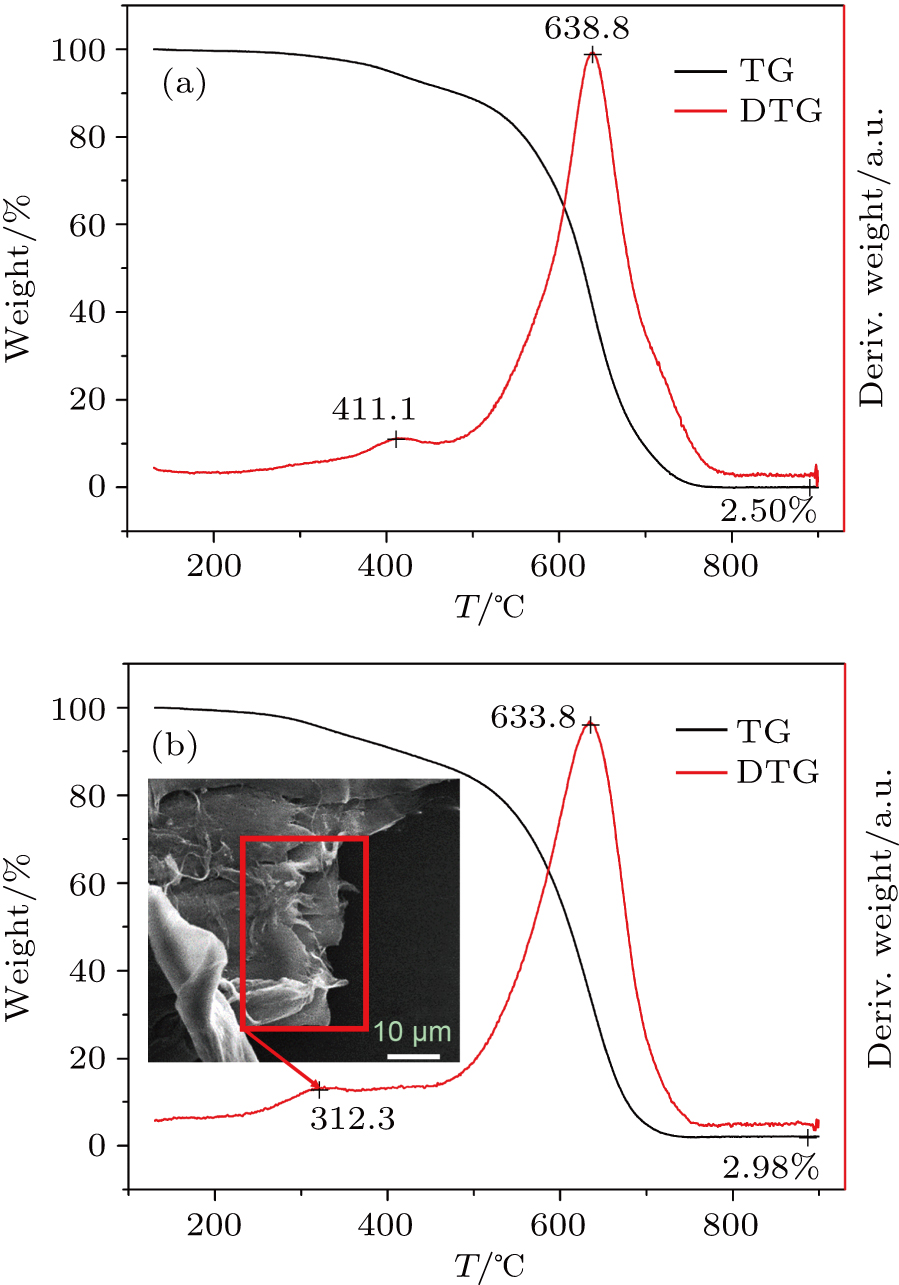
Typical results of thermo–gravimetric (TG) analysis and differential thermo–gravimetric (DTG) analysis of purified, pristine SWNT samples are shown in Fig. 2(a). To compare the results with those of sheared SWNT samples, the SWNT sample is immersed into ethanol after measuring its weight. From this figure, it can be seen that there are a small peak and a main peak at 411.1 °C and 638.8 °C, respectively. The two peaks can be well-assigned to the oxidation temperature of amorphous carbon and SWNTs,[19] respectively. The residual mass is 2.50% and varies a little bit from sample to sample. The TG experiments are repeated three times under the same experimental conditions and the weight percentages of the residue are found to be 2.49%, 2.48%, and 2.50%, respectively. Energy-dispersive x-ray spectra (EDS) indicate that the elements in the residue are mainly iron and oxygen, which are quite uniform for different samples and different locations in the residue of the same sample (Supplementary Material, Fig. S4-1).

Fig. 2. (color online) Thermo–gravimetric (TG) analysis and differential thermo–gravimetric (DTG) analysis of pristine and sheared SWNTs samples. Percentage of SWNTs with sheared ends in SWNT sample can be estimated by the comparison between DTG curves. The experiments are carried out in dry air with a ramp rate 5 °C/min. (a) Typical curve of TG and DTG of purified, pristine SWNTs sample. Small peak at 411.1 °C and main peak at 638.8 °C are attributed to oxidation temperature of amorphous carbon and SWNTs, respectively. Residual mass is 2.50%, which varies a little from sample to sample. (b) Typical TG and DTG curve of sheared SWNTs sample. Comparing with pristine SWNTs, oxidation temperature of SWNTs shifts a little bit to 633.8 °C. There is plateau in DTG curve with starting temperature 312.3 °C. This plateau of DTG curve comes from SWNTs with sheared ends in SWNT sample as shown by inset in SEM image marked with red rectangle. The percentage of SWNTs with sheared ends can be estimated by integrating the corresponding area in DTG curve after subtracting the percentage of amorphous carbon. Residual mass of sheared SWNTs becomes larger due to introduction of trace amount of titanium.

After experiencing the shearing treatment, the curves of TG and DTG of SWNT samples show the following interesting characteristics (Fig. 2(b)). First, a small plateau appears in the DTG curve with a starting temperature as low as 312.3 °C, which is observed in all sheared samples but does not appear in each of pristine SWNT samples. Second, the oxidation temperature of SWNTs shifts a little bit to a temperature of 633.8 °C. Third, the residual mass of the sheared SWNTs is a little (about 0.5%) larger than that of the pristine SWNT samples. The EDS of the residue of the sheared SWNTs indicates that this increase comes from a small amount of titanium and/or titanium oxide, which is mixed into the samples during shearing treatment (Supplementary Material, Fig. S4-1). This means that the sheared SWNT sample differs from its corresponding pristine one by a small amount of titanium (and/or titanium oxide) and some amount of SWNTs with sheared ends. Since the weight of titanium (and/or titanium oxide) does not decrease during TG experiment, the plateau in the DTG curve starting at 312.3 °C, which represents a weight reduction, is attributed to the oxidation of the SWNTs with sheared ends. It should be noted that there are other possibilities for the peaks at 312.3 °C, such as gas desorption and amorphous carbon at the sheared ends of SWNTs. These possible causes can be excluded due to the following reasons: first, if these peaks are from the gas physical/chemical desorption at the defect sites caused during shearing treatment, the weight of these gases should have a value proportional to weight ratio of the carbon atoms at these defect sites. This value can be estimated at 1.86%–6.54% (from Table 1) × 10−4 (typical aspect ratio of SWNT, representing the ratio of carbon atoms at defect sites to other carbon atoms), which is about 4 orders of magnitude smaller than that calculated from the peaks at 312.3 °C. Second, as reported previously, the physical desorption of oxygen and nitrogen usually occur below 100 °C.[20] For the chemical absorption of oxygen on defect or edge site of carbon nanotubes, the desorption temperature can be as high as 600 °C.[21] Third, in this work, the SWNTs are kept in ethanol during shearing and protected in ethanol during transfer for characterization, which means that the SWNTs are isolated from nitrogen and oxygen. Consequently, when the TG experiments are carried out, both adsorption and desorption may happen at the same time and no characteristic peaks are observed in the TG or DTG curves (Fig. 2).

Table 1.

Data of 6 pristine SWNT samples and corresponding sheared ones, from which magnetic moment at sheared ends of SWNTs are obtained. Temperature: 300.0 K; External field: 3.0 T. M0: saturated magnetization of pristine SWNT samples. Superscripts (“α” and “β”) represent that data are obtained with “PPMS-9” (“α”) and “SQUID-VSM” (“β”), respectively. When both appear, it indicates that magnetization is measured with both facilities. M1: saturated magnetization of corresponding sheared SWNT samples. ΔM: M1M0. SWNTs with sheared ends (%): percentage of SWNTs with sheared ends after being treated, which is obtained with corresponding DTG curve. Average ΔM: linear fit of the ΔM of the samples (S1–S6). Average magnetic moment: average increased magnetic moment of each carbon atom of SWNTs in the sheared SWNTs when percentage of SWNTs with sheared ends in SWNT sample is 100%..

.

The excess amorphous carbon may be produced at the sheared ends of SWNTs, and may cause the burning that starts at 312.3 °C. However, this explanation of the burning can be excluded due to the following reasons: first, the weight percentages at which the burning starts at 312.3 °C is in the range of 1.8% to 6.5% in the sheared samples. And this weight percentage is in the same magnitude to that of the amorphous carbon (∼ 8%). Second, it is well-known that amorphous carbon is usually present at the outer walls of nanotubes. Since nanotubes have much larger length than diameter, this suggests that if the burning that starts at 312.3 °C comes from excess amorphous carbon that may be produced at the sheared ends, the excess amorphous carbon should have much higher density and can be easily observed using TEM. As shown in the Supplementary Material, Fig. S4-2, no such amorphous carbon is found.

Therefore, by comparing the TG and DTG curves of a sheared SWNTs sample with those of pristine SWNT sample, the percentage of SWNTs with sheared ends in the sheared sample can be estimated. For pristine SWNT samples, the ratio between amorphous carbon and SWNTs is calculated by using the area of the corresponding peaks in DTG curve. This ratio varies a little from sample to sample. Four pristine SWNT samples are tested and their amorphous carbons have the weight percentages of 8.02%, 8.94%, 9.56%, and 7.58%, respectively. The average value of 8.53% is used in the following calculations. For sheared SWNT samples, the percentage of amorphous carbon and SWNTs with sheared ends can be obtained by calculating the areas in DTG curve (Fig. 2(b)). After subtracting the average percentage of amorphous carbon, the weight percentage of SWNTs with sheared ends in the SWNT samples can be obtained.

These results indicate that the dangling sigma and pi bonds of carbon atoms at edges are more chemically reactive, resulting in lower oxidation temperature in dry air. Meanwhile, the sheared ends of SWNTs provide unique defect structures, which are ideal for the study of defects-caused ferromagnetism; as reported previously in graphene[2227] and MWNTs.[28] Therefore, the following experiments are carried out to measure quantitatively the magnetic moment at the sheared ends of SWNTs.

After the weight of a pristine SWNT sample is measured, the sample is immersed into ethanol and transferred into a sample holder, while the same holder is used for a physical property measurement system (Quantum Design, PPMS9) and a superconducting quantum interference device (Quantum Design, SQUID VSM). The magnetization curves of the SWNT sample are measured by using a vibrating sample magnetometer with a sensitivity of 10−9 A·m2 (PPMS9) or 10−11 A·m2 (SQUID VSM), which utilizes Faraday’s Law to measure the magnetic moment of the sample. After being measured, the SWNT sample is transferred into a centrifuge tube for shearing treatment. After being sheared, the SWNTs sample with some amount of ethanol is transferred back into the sample holder for measurement.

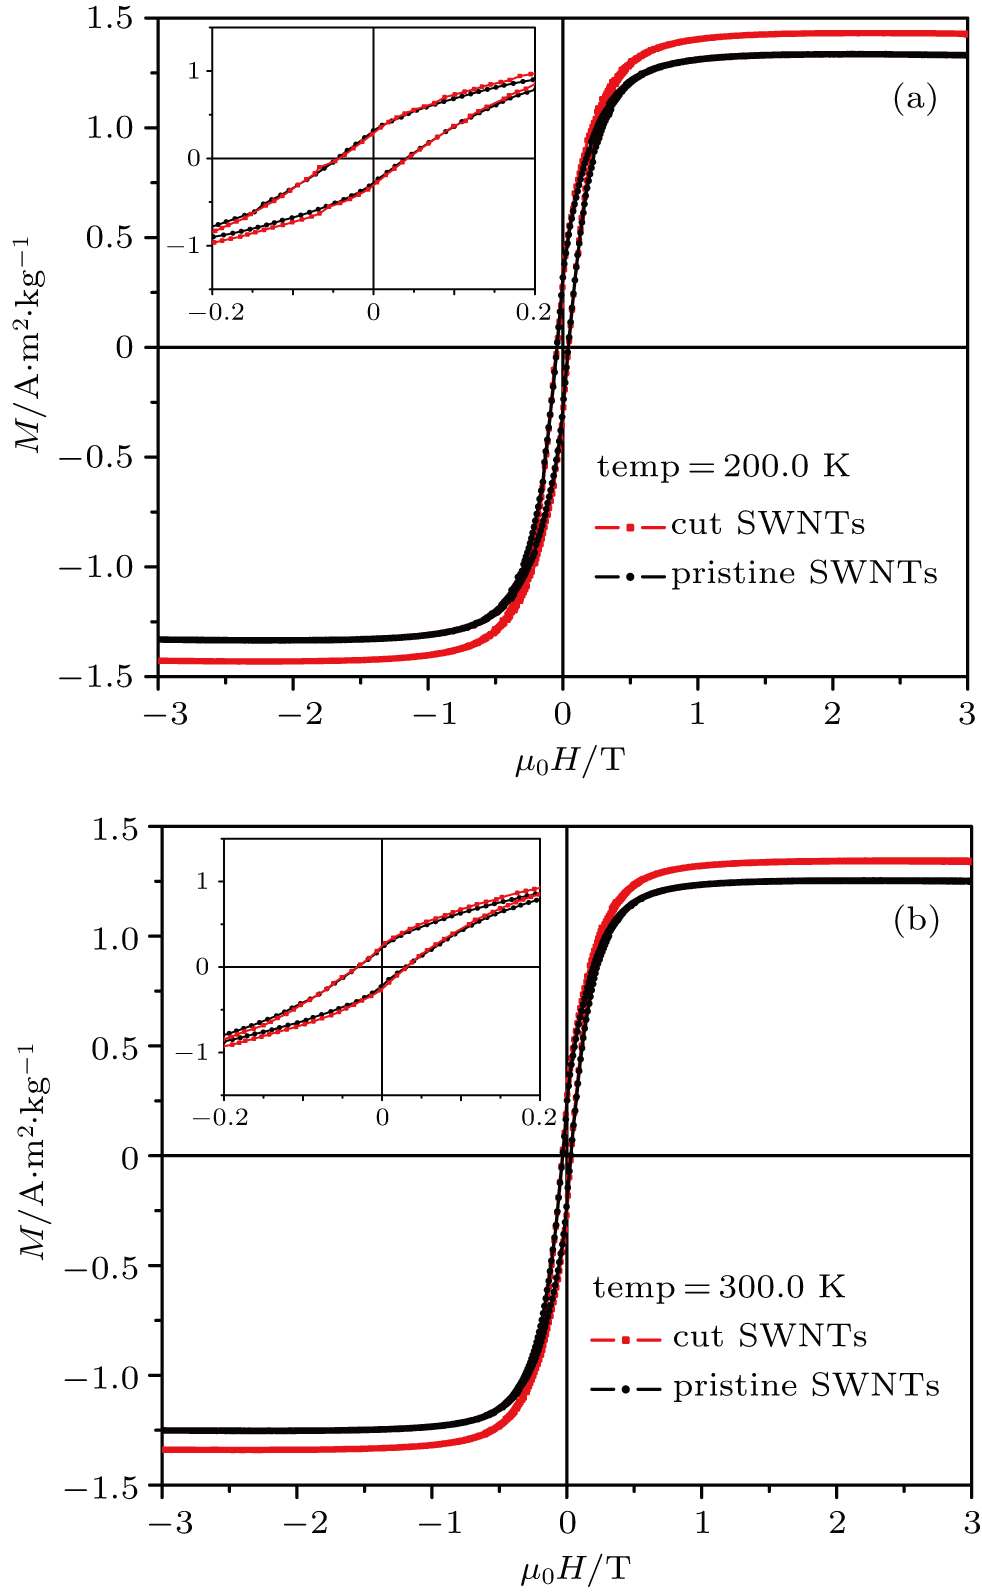
Typical curves of magnetizations (M) against applied field for a pristine (black) and its corresponding sheared (red) SWNTs are shown in Fig. 3 at temperatures of 200.0 K and 300.0 K, respectively. From Fig. 3(a), the following characteristics can be seen clearly. First, the increase of magnetizations with external magnetic field can be divided into three sections: fast increasing, slow increasing and saturation sections in the field ranges of 0T–0.4 T, 0.4 T–1.0 T, and 1.0 T–3.0 T, respectively. When the magnetizations are saturated, they have constant value and do not vary with the increase of external magnetic field. Second, both magnetizations are symmetric for positive and negative external magnetic field. The top left-hand inset of Fig. 3(a) displays the hysteretic parts of the two magnetizations, indicating that both have a similar coercivity about 43 mT at 200.0 K. Third, the magnetization of the sheared SWNTs is larger than that of its corresponding pristine sample. This can be seen more clearly when the external magnetic field is in a range from 1.0 T to 3.0 T. When the temperature is raised to 300.0 K, similar characteristics of the magnetizations can be observed (Fig. 3(b)). The values of saturated magnetizations become smaller than those at 200.0 K. Meanwhile, both magnetizations have coercivity with the same value about 31 mT at 300.0 K (the top left inset in Fig. 3(b)).

Fig. 3. (color online) Magnetization isotherms of typical pristine (black) and its corresponding sheared (red) SWNTs sample at temperatures 200.0 K and 300.0 K, respectively. (a) Plots of magnetization (M) against applied magnetic field at temperature 200.0 K. Increase of magnetizations with external magnetic field can be divided into three sections: fast increase, slow increase and saturation section in field ranges: 0 T–0.4 T, 0.4 T–1.0 T, and 1.0 T–3.0 T, respectively. Both magnetizations are symmetric for positive and negative external magnetic field. Magnetization of sheared SWNTs is larger than that of its corresponding pristine one, suggesting existence of magnetic moment at sheared ends of SWNTs. Top left inset displays hysteretic parts of two magnetizations, indicating both have similar coercivity about 43 mT. (b) Typical curves of magnetization (M) at temperature 300.0 K. Similar characteristics of magnetizations are observed to those in temperature 200.0 K. Values of saturated magnetizations become smaller than that at 200.0 K. Both magnetizations have the same coercivity with value about 31 mT (inset).

These curves of magnetizations of pristine (black) and sheared (red) SWNTs samples indicate clearly that there are ferromagnetism and magnetic moment in these samples. For pristine, purified SWNTs samples, although the weight purities of these SWNTs samples are all as high as 97.5%, there is still trace amount of iron and/or iron oxide (Supplementary Material, Fig. S4-1). Due to the small content of these phases, it is quite difficult and challenging to implement a quantitative analysis of these phases. This makes the quantitative analysis of the magnetizations of pristine SWNTs samples quite difficult. The very small differences among the residual mass of pristine samples (∼ 0.01%) suggest that the content and ratios of iron and iron oxide are quite uniform among pristine samples. The values of magnetization (M) of pristine SWNTs samples vary quite a lot from sample to sample, as shown in Table 1. This may imply there is magnetizations from SWNTs, which varies from sample to sample.

Another quite interesting and important result from Fig. 3 and Table 1 is that the magnetizations of sheared SWNT samples are larger than those of the corresponding pristine SWNT samples. The differences between the sheared SWNTs samples and their corresponding pristine ones are some amount of SWNTs with sheared ends and trace amount of titanium and/or titanium oxide (∼ 0.5%). The increase of the magnetization from titanium can be excluded due to the following reasons: first, titanium is a typical paramagnetic material. If the increased magnetization is from Ti, linear relationship of magnetization versus magnetic field should be observed when the external field is increased. This is in clear discrepancy with our results shown in Figs. 3(a) and 3(b), where the saturation of magnetization is observed when the external field is larger than 1.0 T. Second, the elemental analysis of the residues (Supplementary Material, Table S1) indicates that the weight percent of the Ti element in the residues of sheared SWNTs is about 8.1%, while the weight percent of the residues of sheared SWNTs is 2.98%. This means that the weight percent of the Ti element in the sheared SWNT is only 0.24% (8.1% × 2.98%). If the increase of the magnetic moment is from the Ti element, then the magnetic moment of Ti atom should be around 0.8 μB/atom at room temperature and an external field of 1 T, which is not possible for a paramagnetic metal. Third, as shown below, the increase of magnetization is proportional to the quantity of SWNTs with sheared ends, suggesting that this increase of magnetization results from the sheared open ends of SWNTs.

Table 1 summarizes the characterizations and measurements for six samples of SWNTs. The increase of magnetization (M1M0) is linearly related to the percentage of SWNTs with sheared ends, which are obtained from their corresponding DTG curves of the sheared samples. By the linear fitting of the increased magnetizations of these samples, an average increased magnetization of (1.72 ± 0.27) × 10−2 A·m2/(kg·%) is obtained (Table 1). This value represents average increased magnetizations when one percent of SWNTs are successfully sheared (one percent of SWNTs with sheared ends in the SWNTs sample after being treated). If each individual SWNT is sheared once, which corresponds to 100% of SWNTs, then an average increased magnetization of 1.72 ± 0.27 A·m2/kg is expected. This value can be converted into an average increased magnetic moment of each carbon atom of SWNTs due to shearing treatment, which is (4.15±0.98)×10−3 μB/atom as shown in Table 1. This increased magnetic moment comes from a tiny fraction of carbon atoms at the edges of the sheared ends of SWNTs. Therefore, the magnetic moment of the carbon atoms at the edge sites of the sheared ends of SWNTs can be obtained by using this value multiplied with a factor. This factor represents the ratio of the carbon atoms of SWNTs to those carbon atoms at the edge sites of the sheared ends of the SWNTs (Supplementary Material, Fig. S4-2). An exceptionally high value of 364 ± 86 μB (Bohr magneton) per carbon atom at the edge sites of the sheared ends of SWNTs is obtained at a temperature of 300.0 K. If edge (end) states[29] with a width of 1 nm are formed due to relaxation and reconstruction at the sheared ends of SWNTs,[30] the average magnetic moment is 41.5 ± 9.8 μB per carbon atom in the edge (end) states, suggesting that ultrahigh magnetic fields can be produced at the sheared ends of SWNTs. As for the unexpected large value of magnetic moment per edge (end) carbon atom, one possible reason may be that this large magnetic moment is closely related to the very small effective mass of π electron in carbon nanotube, which can be calculated with /2m*. Here, m* is the effective mass of π electron, e the charge of an electron, and ħ the Planck constant. For example, the effective mass of π electron in graphene is found to be in a range of 0.02 me–0.05me (me is the mass of free electron)[31] and the corresponding magnetic moment can be several tens of Bohr magnetons.

It should be noted that the magnitudes of magnetic moments at the sheared ends of SWNTs are different from those reported previously at the open ends of MWNTs.[28] The possible reasons may be as follows. First, the samples are different. In Ref. [28], MWNTs are used rather than SWNTs as reported in this work. This may suggest that the diameter and hence curve of nanotubes may have effects on the magnetic moment. Second, in Ref. [28], the magnetic moment is obtained indirectly, which is calculated from the deflection of a cantilever of a bundle MWNT, while in this work the magnetic moments at the sheared ends of SWNTs are obtained directly by using PPMS and SQUID, which are the most sensitive equipment for measuring magnetic signals. Third, it is not clear whether the magnetic moment depends on the atomic end and/or nanotube structure since the SWNTs in this work are a mixture of SWNTs with different diameters and chiralities, which deserves more theoretical and experimental studies.[3234]

4. Conclusions

In this work, we show that SWNTs can be successfully sheared along a direction perpendicular to the axis of SWNTs by using a pair of titanium scissors. The oxidation of SWNTs with sheared ends starts at a temperature as low as 312 °C in dry air. At a temperature of 300.0 K, if edge states with a width of 1 nm are formed, the average magnetic moment is 41.5 ± 9.8 μB per carbon atom in the edge states, suggesting that ultrahigh magnetic fields can be produced at the sheared ends of SWNTs. Producing a ultrahigh magnetic field by using the SWNTs has the advantages of a higher working temperature and low energy consumption, implying their great potential applications.

Reference
[1] Lai D 2001 Rev. Mod. Phys. 73 629
[2] Klitzing K Dorda G Pepper M 1980 Phys. Rev. Lett. 45 494
[3] Novoselov K S Geim A K Morozov S V Jiang D Katsnelson M I Grigorieva I V Dubonos S V Firsov A A 2005 Nature 438 197
[4] Tsui D C Stormer H L Gossard A C 1982 Phys. Rev. Lett. 48 1559
[5] Yu R Zhang W Zhang H Zhang S Dai X Fang Z 2010 Science 329 61
[6] Qi Y Lv S Du A Yu N 2016 Chin. Phys. 25 117501
[7] Chang C Z Zhang J Feng X Shen J Zhang Z Guo M Li K Ou Y Wei P Wang L L Ji Z Q Feng Y Ji S Chen X Jia J Dai X Fang Z Zhang S C He K Wang Y Lu L Ma X C Xue Q K 2013 Science 340 167
[8] Lange K K Tellgren E I Hoffmann M R Helgaker T 2012 Science 337 327
[9] Salili S M Tamba M G Sprunt S N Welch C Mehl G H Jákli A Gleeson J T 2016 Phys. Rev. Lett. 116 217801
[10] Haravifard S Graf D Feiguin A E Batista C D Lang J C Silevitch D M Srajer G Gaulin H Dabkowska A Rosenbaum T F 2016 Nat. Commun. 7 11956
[11] Lauterbur P C 1973 Nature 242 190
[12] Shou Q Y Feng L Long Y Han J Nunnery J K Powell D H Butcher R A 2016 Nat. Chem. Biol. 12 770
[13] Weijers H W Markiewicz W D Gavrilin A V Voran A J Viouchkov Y L Gundlach S R Noyes P D Abraimov D V Bai H Hannahs S T Murphy T P 2016 IEEE Trans. Appl. Supercond. 264 300807
[14] Jiles D C 2015 Introduction to Magnetism and Magnetic Materials London CRC Press
[15] Feynman R P 1964 The Feynman Lectures on Physics Leighton, Robert B.; Sands Matthew
[16] Zhang J Liu S Nshimiyimana J P Deng Y Hou G Chi X Hu X Zhang Z Wu P Wang G Chu W Sun L 2017 Small 13 1701218
[17] Yu M F Lourie O Dyer M J Moloni K Kelly T F Ruoff R S 2000 Science 287 637
[18] Nakada K Fujita M Dresselhaus G Dresselhaus M S 1996 Phys. Rev. 54 17954
[19] Shi Z J Lian Y Liao F Zhou X Gu Z Zhang Y Iijima S 1999 Solid State Commun. 112 35
[20] Choucair M Tse N M K Hill M R Stride J A 2012 Surf. Sci. 606 34
[21] Zhu X Y Lee S M Lee Y H Frauenheim T 2000 Phys. Rev. Lett. 85 2757
[22] Han K H Spemann D Esquinazi P Hohne R Riede V Butz T 2003 Adv. Mater. 15 1719
[23] Ohldag H Tyliszczak T Höhne R Spemann D Esquinazi P Ungureanu M Butz T 2007 Phys. Rev. Lett. 98 187204
[24] Cervenka J Katsnelson M I Flipse C F J 2009 Nat. Phys. 5 840
[25] Wang Y Huang Y Song Y Zhang X Ma Y Liang J Chen Y 2009 Nano Lett. 9 220
[26] Zhou P He D W 2016 Chin. Phys. 25 017302
[27] GonzalezHerrero H GómezRodríguez J M Mallet P Moaied M Palacios J J Salgado C Ugeda M M Veuillen J V Yndurain F Brihuega I 2016 Science 352 437
[28] Wang G Chen M Yu F Xue L Deng Y Zhang J Qi X Gao Y Chu W Liu G Yang H Gu C Sun L 2015 Chin. Phys. 24 016202
[29] Zhang Y Li S Y Huang H Li W T Qiao J B Wang W X Yin L J Bai K K Duan W He L 2016 Phys. Rev. Lett. 117 166801
[30] Kim P Odom T W Huang J L Lieber C M 1999 Phys. Rev. Lett. 82 1225
[31] Novoselov K S Geim A K Morozov S V Jiang D Katsnelson M I Grigorieva I V Dubonos S V Firsov A A 2005 Nature 438 197
[32] Yang F Wang X Zhang D Yang J Luo D Xu Z Wei J Wang J Xu Z Peng F Li X Li R Li Y Li M Bai X Ding F Li Y 2014 Nature 510 522
[33] Wei Q Wei Z Ren L Zhao H Ye T Shi Z Fu Y Zhang X Huang R 2012 Chin. Phys. 21 088103
[34] Zhang J Deng Y Hu X Nshimiyimana J P Liu S Chi X Wu P Dong F Chen P Chu W Sun L 2018 Adv. Sci. 5 1700588