† Corresponding author. E-mail:
Project supported by the Natural Science Foundation of Shandong Province, China (Grant No. ZR2017PF011), the National Natural Science Foundation of China (Grant No. E020701), and the Doctoral Scientific Research Foundation of Binzhou University, China (Grant No. 2014Y10).
In this paper, core–shell quantum dots (QDs) with two polar surface functional groups (ZnSe/ZnS–COOH QDs and ZnSe/ZnS–NH2 QDs) are synthesized in an aqueous phase. Photoluminescence (PL) and absorption spectra clearly indicate luminescence down-shifting (LDS) properties. On the basis of QDs, surface functional group multilayer LDS films (M-LDSs) are fabricated through an electrostatic layer-by-layer (LBL) self-assembly method. The PL intensity increases linearly with the number of bilayers, showing a regular and uniform film growth. When the M-LDS is placed on the surface of a Si-based solar cell as an optical conversion layer for the first time, the external quantum efficiency (EQE) and short-circuit current density (Jsc) notably increases for the LDS process. The EQE response improves in a wavelength region extending from the UV region to the blue region, and its maximum increase reaches more than 15% between 350 nm and 460 nm.
With the rapid development of the photovoltaic industry, the high efficiency and the low cost of photovoltaics becomes a main research target. One of the most main constraints of solar cell efficiency is the energy loss caused by spectral mismatch.[1–3] The latter refers to the fact that the photon energy on the surface of the solar cell is lower than the forbidden bandwidth of the material, so this part of the energy cannot be effectively utilized. For example, the response (shortwave spectral response) is low for Si-based cells and CdTe thin film solar cells, but the spectral response is relatively high in the visible wavelength region.[4] There are two effective approaches to solving this spectral mismatch. One is to adjust the battery structure in order to utilize the sunlight to a maximum extent; the other is to adopt spectrum conversion to increase the spectral response of the solar cell.[5–7] Luminescent down-shifting (LDS) is one of the most effective methods for spectral conversion. The LDS process is a simple and pure spectral conversion procedure, in which the material absorbs a high-energy photon and emits low-energy photons.[8,9] This spectral transfer property results in the weakness of response in short wave region of Si-based solar cells and CdTe thin film solar cells. In this regard, core–shell quantum dots (QDs) with unique photoelectric properties become an excellent candidate material for LDS.[10–12]
In order to effectively utilize the fluorescence transfer characteristics of QDs, direct spin-coating on the surface of solar cells was used initially.[13] This specific approach has the advantage that the structure of the cell is not changed and the absorption of the converted spectrum reaches a maximum value.[14,15] However, if the QDs are placed directly on the surface of the solar cell, then they will be easy to cluster and show poor light stability. For the LDS application, the difficulty of controlling film quality is a major drawback. In order to further improve the film-forming quality of the QDs, many kinds of amphiphilic surfactants mixed with QDs have been employed.[16,17] The quality of the film is better than that of simple QDs, and the thickness can be accurately controlled by changing the coating time. Although this method modifies the surface of QDs to make them photobleaching-resistant, the method has limited applications because a polymer layer with opposite polarity is required; the luminescence efficiency of QD layer is affected; the QDs can be easily caused to cluster by the direct mixing with polymer; the polymer flexible polymer chains intertwine; and other problems.[18] These disadvantages will affect the structure, uniformity, thermal stability and luminescence efficiency of LDS films.
In this paper, we prepare ZnSe/ZnS core–shell QDs with –NH2 and –COOH groups. The composition, morphology and luminescence characteristics of ZnSe/ZnS core–shell QDs are studied. The M-LDSs are fabricated for the first time by alternate adsorption of the ZnSe/ZnS–NH2 QDs endowed with positive groups (
ZnSe/ZnS–NH2 QDs were prepared in water phase.[19] Se powder was initially added to the NaBH4 solution (NaBH4:Se = 2:1) in N2 atmosphere. When the solution becomes transparent it is added to deionized water to form 0.5-M NaHSe solution. The solution was rapidly injected into ZnNO3.6H2O and 3-Mercaptopropionic acid (MPA) mixed solution and heated at 100 °C. The ratio of Zn2+/Se2–/MPA was 1:0.9:20. The reaction solution was centrifuged at 1.8×10⁴ r/min∼ 2.0×10⁴ r/min speed to remove the supernatant and the remaining precipitate was washed several times with anhydrous ethanol to obtain pure ZnSe nanoparticles. After purification, the ZnSe nanoparticles were dispersed in deionized water. The 20-ml ZnNO3.6H2O as the precursor, and 2-ml MPA were added into the purification solution of ZnSe. The mixture was heated at 90 °C until the reaction was completed. The pure ZnSe/ZnS–COOH QDs were obtained by centrifuging and cleaning in the same way.
The preparation procedure of ZnSe/ZnS–NH2 QDs was the same as that of ZnSe/ZnS–COOH QDs, except that the functional group precursors were changed from MPA to cysteamine.
Ultrasonic dispersion of 0.6-mo/L ZnSe/ZnS–COOH QDs solution and ZnSe/ZnS–NH2 QDs solution were spin-coated on Si-based solar cells LBL at a rotational speed of 300 rpm/s. Finally, one bilayer film (BL) is formed uniformly by electrostatic interaction for 20 s.
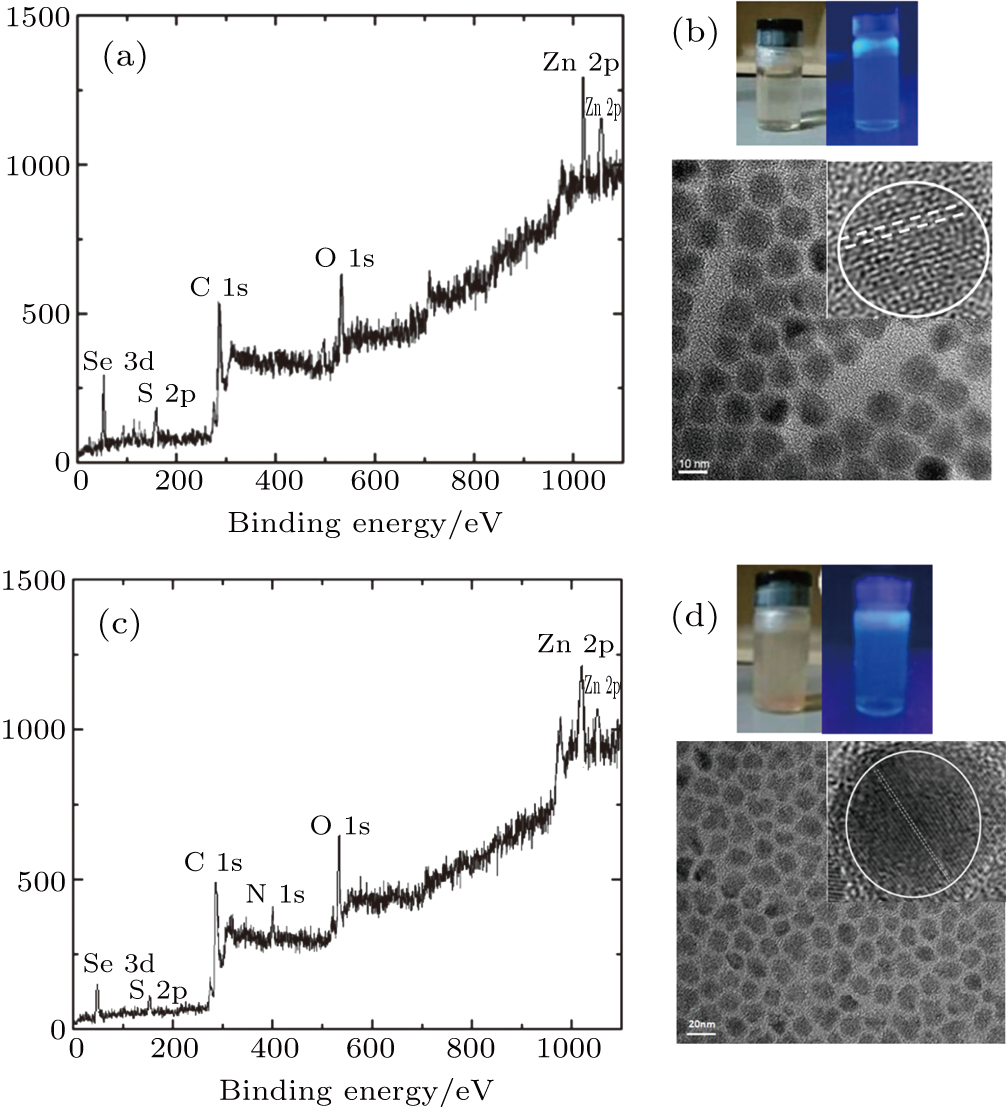
The two functional groups (–COOH and –NH2) of the ZnSe/ZnS core–shell QDs can be confirmed by x-ray photoelectric spectroscopy (XPS) measurements, as shown in Figs.
The transmission electron microscopy (TEM) images and selective area electron diffraction (SAED) patterns of ZnSe/ZnS–COOH QDs and ZnSe/ZnS–NH2 QDs are depicted in Figs.
The optical properties of ZnSe/ZnS–COOH QDs and ZnSe/ZnS–NH2 QDs are presented in Figs.
The multilayer LDS films (M-LDSs) based on two surface functional groups of QDs (ZnSe/ZnS–COOH QDs and ZnSe/ZnS–NH2 QDs) are fabricated through the LBL self-assembly method as described above. The bilayer (BL) indicates that the film is prepared once by LBL assembly of opposite charged QDs. The PL and absorption spectra of different M-LDSs are also obtained as shown in Figs.
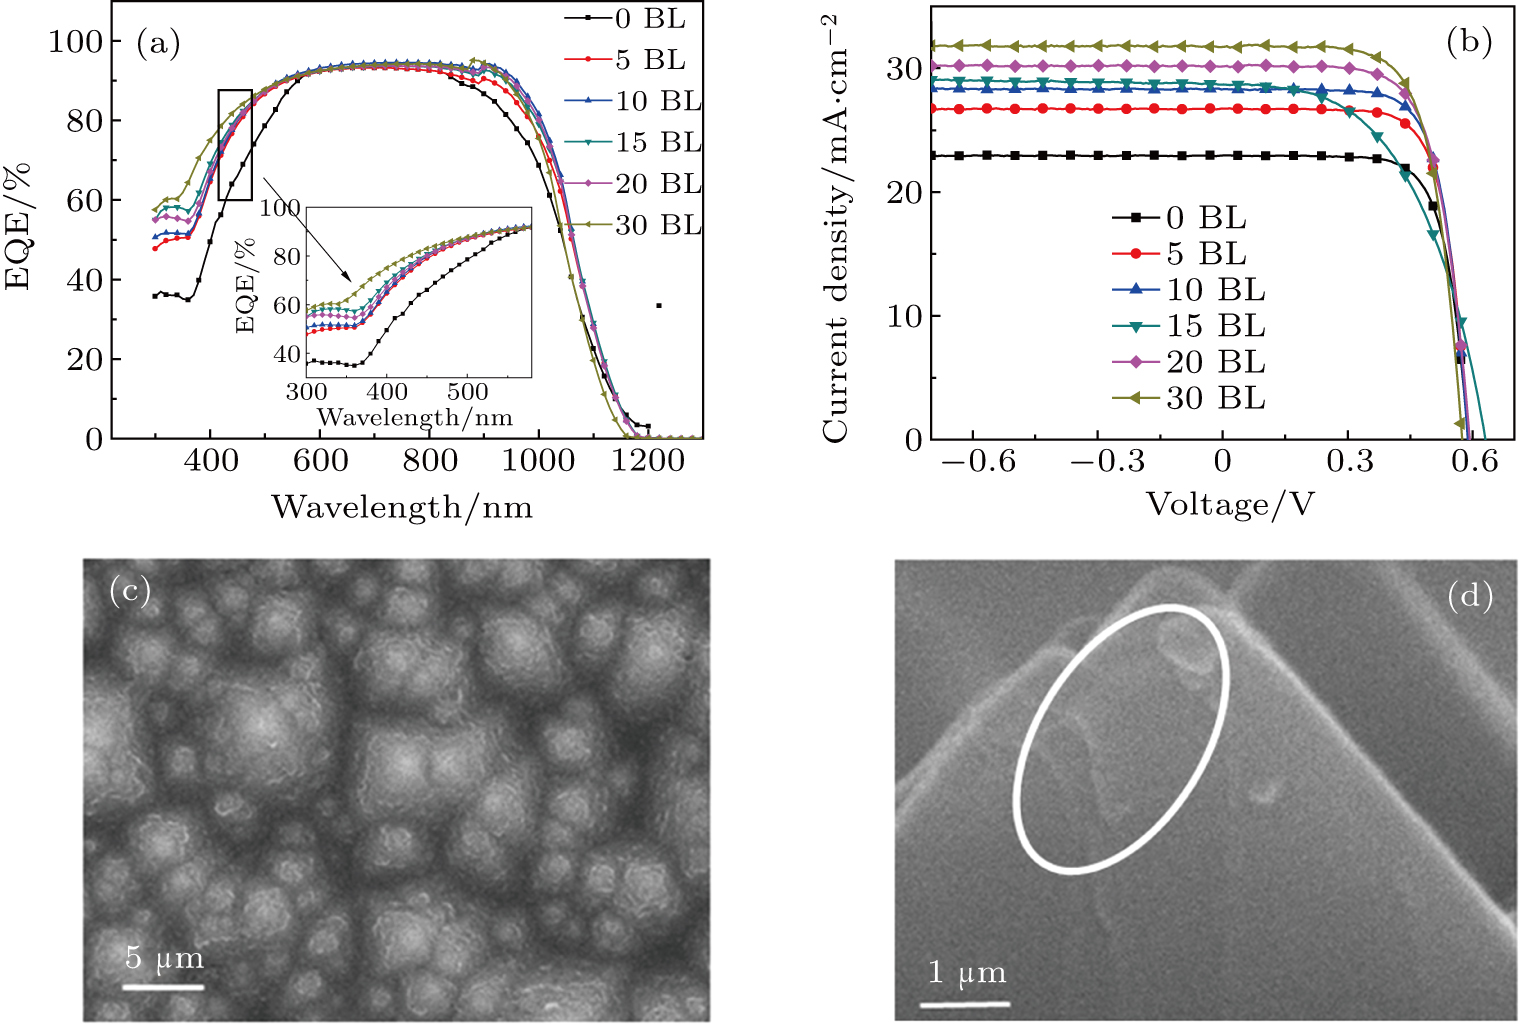
The ZnSe/ZnS–COOH and ZnSe/ZnS–NH2 QDs with two functional groups are self-assembled by the electrostatic LBL process on the surface of the Si solar cell as an optical conversion layer. The EQE and Jsc are measured to evaluate the spectrum response of the fabricated Si solar cells with different numbers of bilayers as shown in Fig.
Figure
The surface profiles of the Si solar cells with 20-BL LDSs were confirmed by SEM (Figs.
In this work, we have synthesized ZnSe/ZnS core–shell QDs with positive (–NH2) and negative (–COOH) functional group on the surface. On the basis of these QDs, novel multilayer LDS films are fabricated via an electrostatic LBL self-assembly process. The two functional groups are confirmed by XPS results. The PL intensity of the fluorescence peak increases linearly with the number of bilayers. For M-LDSs of ZnSe/ZnS–COOH and ZnSe/ZnS–NH2 QDs coated on the surface of bare Si-based solar cells, the EQE notably increases due to the luminescent down-shifting process. The EQE response is improved by more than 15% between 350 nm and 460 nm, whereas the Jsc of Si solar cell is increased from 22 mA/cm2 (0 BL) to 31 mA/cm2 (30 BL). Such small but distinct improvements are expected to provide the fundamental and practical basis for developing Si-based solar cells with mass-compatible techniques that could promote their widespread utilization.
| [1] | |
| [2] | |
| [3] | |
| [4] | |
| [5] | |
| [6] | |
| [7] | |
| [8] | |
| [9] | |
| [10] | |
| [11] | |
| [12] | |
| [13] | |
| [14] | |
| [15] | |
| [16] | |
| [17] | |
| [18] | |
| [19] | |
| [20] | |
| [21] | |
| [22] |


