Effects of dielectric decrement on surface potential in a mixed electrolyte solution
Peng Jing, Zou Wen-Xin, Tian Rui, Li Hang, Liu Xin-Min
Chongqing Key Laboratory of Soil Multiscale Interfacial Process, College of Resources and Environment, Southwest University, Chongqing 400715, China


† Corresponding author. E-mail: lucimir@163.com

Project supported by the National Natural Science Foundation of China (Grant Nos. 41501240, 41530855, 41501241, and 41877026), the Natural Science Foundation of Chongqing CSTC (Grant No. cstc2018jcyjAX0318), and the Fundamental Research Funds for the Central Universities, China (Grant No. XDJK2017B029).

Abstract

Surface potential is an important parameter related to the physical and chemical properties of charged particles. A simple analytical model for the estimation of surface potential is established based on the Poisson–Boltzmann theory with the consideration of the dielectric decrement in mixed electrolyte. The analytical relationships between surface potential and charge density are derived in different mixed electrolytes with monovalent and bivalent ions. The dielectric decrease on the charged surface strongly affects the surface potential at a high charge density with different ion strengths and concentration ratios of counter-ions. The surface potential based on the Gouy–Chapman model is underestimated because of the dielectric decrement on the surface. The diffuse layer can be regarded as a continuous uniform medium only when the surface charge density is lower than 0.3 C·m−2. However, the surface charge densities of many materials in practical applications are higher than 0.3 C·m−2. The new model for the estimation of surface potential can return to the results obtained based on the Gouy–Chapman model at a low charge density. Therefore, it is implied that the established model that considers the dielectric decrement is valid and widely applicable.

1. Introduction

Surface potential is an important parameter of nano-colloidal particles. It determines many ion–surface and surface–surface interactions, such as ion adsorption and transport near the surface,[13] interparticle force,[4] aggregate stability[5] and deposition phenomena.[6] Therefore, the estimation of surface potential is a significant issue in colloidal and interfacial chemistry. However, an important physical factor, dielectric decrement at the solid–liquid interface, has been neglected in theories for the estimation of surface potential.

The theories and methods of estimating the surface potential have been proposed based on the double-layer theory,[713] the second harmonic generation method,[14,15] x-ray photoelectron spectroscopy method,[16] and replacement by zeta potential.[17] The double-layer[79] and second harmonic generation[14,15] methods are mainly based on the Gouy–Chapman (GC) model and density functional theory.[10,11] The hydration repulsion between particles is taken into account in the experimental method based on x-ray photoelectron spectroscopy.[16] The surface potential is usually replaced by the zeta potential that only depends on the magnitude of the shear interface charges. In this study, the surface potential is the potential at the original plane of the diffuse layer or Stern plane, and the shear plane is far from Stern plane[17,18] so it cannot be used as a substitute.

A strong electric field, up to hundred millions volt per meter, exists near a charged surface.[2] The electric field influences the water molecules at the interface, which can significantly reduce the dielectric constant of the medium.[19] The lower dielectric permittivity in this strong electrostatic field will further enhance the complexity of the charged ions into neutral species.[20,21] In predecessors’ methods to measure the surface potential,[22,23] the dielectric decrement was neglected and the surface potential was thus inaccurately estimated.

Furthermore, mixed electrolyte solutions, rather than a single-electrolyte solution, are often encountered in practical applications. Zhao et al. provided a concise description of the GC theory for NaCl/CaCl2 mixtures,[24] which is one of the electrolyte mixtures with monovalent and divalent ions (co-ions and counter-ions). In fact, the interfacial behaviors described by Poisson–Boltzmann (PB) theory depend on the electrolyte composition with different ionic species. However, a simple analytical method of estimating the surface potential in mixed electrolytes considering the dielectric decrement should be established to conveniently apply the PB theory. A theory that more accurately describes the surface potential would provide us with a much more in-depth understanding and a more rational approach to investigating the interfacial behaviors.

The principles for the estimation of the surface potential in mixed electrolytes were proposed in our previous study;[25] nevertheless, the effects of the dielectric decrement on surface potential were neglected. Therefore, an analytical method to estimate the surface potential by considering dielectric decrement is established, and the effects of the dielectric decrement on the surface potential are investigated in this study.

2. Theory
2.1. Surface potential estimation considering dielectric decrement based on the Poisson–Boltzmann equation

According to the PB equation and the definition of the electric field E = dφ/dx at boundary x → ∞, E = 0, and φ = 0, and at the Stern plane x → 0, E = E0 and φ = φ0, one obtains where g(E0) is a function of the electric field strength at the solid–liquid interface, E0 is the electric field strength at the surface, ε0 is the vacuum dielectric constant, D is the relative dielectric function of the medium, D0 is the relative dielectric constant at the charged surface, Zi is the valence of ion species i, fi is the concentration of ion species i in bulk solution, F is the Faraday constant, R is the gas constant, T is the absolute temperature and φ0 is the surface potential of the particle.

Equation (1) shows that if the function g(E0) is known, the surface potential can be calculated theoretically.

When the dielectric decrement is neglected, Eq. (2) becomes , where E0 = σ0/ε0D0, thus g(E0) is actually a function of surface charge density σ0, and ), where Dw is the relative permittivity of water in bulk solution. Therefore, Eq. (1) can be written as In the GC theory, the dielectric property in the diffusion layer is assumed to be a continuous medium such as water.[26] However, the dielectric constant at the surface with strong electric field can be reduced to a very low value.[19]

In this study, we select a dielectric function: where n = 0.128 is the parameter fitted by a Langevin function of the dielectric constant,[27,28] Dw is the relative permittivity of water, α = pw/kT, pw is the magnitude of the water dipole moment, k is Boltzmann constant and T is the absolute temperature. At T = 298 K, α = 3.94 × 10⁻⁹ m·V−1.

Substitution of Eq. (4) into Eq. (2) leads to The relationship between the electric field strength and charge density can be obtained by the Gauss theorem E = σ /ε0D, and combining it with Eq. (4), one obtains Equation (6) shows that once the surface charge density is determined in advance, the electric field strength at the surface can be calculated.

Combining Eqs. (5) and (1), we obtain Therefore, the surface potential can be estimated by using Eq. (7).

2.2. Analytical method of estimating surface potential in mixed electrolyte

Although Eq. (7) can be used to estimate the surface potential, analytical expressions are not derived in different mixed electrolytes, and the calculations are complex. Therefore, in the following subsections we will derive simple analytical expressions of the surface potential in different electrolytes.

2.2.1. Single electrolyte

For 1:1 (AB) single electrolytes, the valence ions A and B are ZA = 1 and ZB = −1, respectively, and their ion concentrations are related by fB = fA. Equation (7) can be written as For a 1:2 (C2D) single electrolyte, the valence of ions C and D are ZC = 1 and ZD = −2, respectively, and their ion concentrations are related by fD = fC/2. Equation (7) can be written as For a 2:1 (EM2) single electrolyte, the valence of ions E and M are ZE = 2 and ZM = −1, and their ion concentrations are related by fM = 2fE. Equation (7) can be written as When eZcounterionFφ0 ≫ eZcoionFφ0, a general expression is obtained in different single electrolytes: where Z is the valence of counterion, f is the concentration of counterion, r is the corresponding constant for different electrolyte: r = 2 for 1:1 electrolyte, r = 3 for |Zcounterion|:|Zcoion|=2:1 electrolyte, and r = 3/2 for |Zcounterion|:|Zcoion|= 1:2 electrolyte.

2.2.2. 1:1+1:1 mixed electrolytes

For 1:1+1:1 ( AB + AB’) mixed electrolytes, the valence of ions A and A′, and B and B’ are ZA = ZA = 1 and ZB = ZB = −1, and their ion concentrations are fB = fA and fB = fA. Equation (7) can be written as When eZcounterionFφ0 ≫ eZcoionFφ0, equation (12) can be rewritten as

2.2.3. 2:1 + 1:2 mixed electrolytes

For 2:1 + 1:2 ( EM2 + C2D) mixed electrolytes, the valence of ions E, M, C, and D are ZE = 2, ZM = −1, ZC = 1, and ZD = −2, respectively, and their ion concentrations are related by 2fE = fM and fC = 2fD. Equation (7) can be written as For a negatively charged surface φ0 <0, if equation (14) satisfies: or by omitting the higher-order small quantity 0.95fC e3Fφ0/RT, equation (16) can be rewritten as Thus Equation (14) can be simplified into The solution of Eq. (19) is For a positively charged surface φ0 > 0, if equation (14) satisfies or equation (14) can be rewritten as follows: The solution of Eq. (23) is

2.2.4. 2:2 + 1:2 mixed electrolytes

For 2:2 + 1:2 (EM + C2D) mixed electrolytes, the valence of ions E, M, C, and D are ZE = 2, ZM = −2, ZC = 1, ZD = −2, respectively, and their ion concentrations are related by fE = fM and fC = 2fD. Equation (7) can be written as For a negatively charged surface φ0 <0, if equation (25) satisfies or Equation (25) can be rewritten as follows: The solution of Eq. (28) is For a positively charged surface φ0 > 0, if equation (25) satisfies or Eq. (25) can be rewritten as follows: The solution of Eq. (32) is

2.2.5. 2:2 + 2:1 mixed electrolytes

For a 2:2 + 2:1 (EM + CD2) mixed electrolyte, the valence of ions E, M, C, and D are ZE = 2, ZM = −2, ZC = 2 and ZD = −1, and the ion concentrations are fE = fM and 2fC = fD. Equation (7) can be written as For a negatively charged surface φ0 <0, if equation (34) satisfies or equation (34) can be rewritten as follows: The solution of Eq. (37) is For a positively charged surface φ0 > 0, if equation (34) satisfies or equation (34) can be rewritten as follows: The solution of Eq. (41) is

3. Results and discussion
3.1. Dielectric decrement at the solid–liquid interface

Based on the distribution of electric field in the diffuse layer, the dielectric decrement in the double layer can be approximatively estimated by using Eq. (4). In the present study, the dielectric decrement in a single 1:1 single electrolyte is used as an example to be described at the solid–liquid interface.

The potential distribution in the 1:1 electrolyte is[29] where κ is the Debye parameter, , f is the concentration of counterion and Dw is the relative permittivity of water in bulk solution. It is important to mention that the potential distribution is derived by using classical PB equation.

Thus the electric field E = dφ/dx, specifically Combining Eqs. (4) and (44), the variation of relative dielectric function of the medium as a function of position x can be obtained to be

The surface potential in Eq. (45) is estimated by Eq. (11), and the dielectric function is shown in Fig. 1. The dielectric constant at the charged surface decreases with surface charge density increasing (Fig. 1(a)). The dielctric constant obviously decreases when the surface charge density exceeds 0.1 C·m−2. The dielectric decrement mainly occurs at a distance of 0.5 nm from charged surface (Fig. 1(b)).

Fig. 1. Dielectric constant as a function of (a) surface charge density in an inhomogeneous dielectric medium and (b) distance from charged surface in 0.001 mol·L−1 of a 1:1 electrolyte solution.
Fig. 2. (color online) Comparison between surface potential and zeta potential of montmorillonite with charge density of 0.1129 C·m−2 in KNO3 electrolyte solutions. Data were cited from our previous study.[18]

Theoretically, the electric field in a double layer depends on the salt concentration, because the thickness of a double layer is determined by electrolyte concentration.[18] Gavish et al. provided a model of dielectric properties as a function of salt concentration with considering the electric field created by ions.[30] In the present study, the correlation between ions is neglected and the electric field is generated by the surface charges of nano-colloidal particles.

The surface potential is usually replaced by the zeta potential.[31,32] Based on the theoretical calculation of Eq. (11), it is now possible to provide a comparison between the surface potential and zeta potential in KNO3 electrolyte solution.[18] The zeta potential is much lower than the surface potential, which implies that the position of the shear plane is far away from the Stern plane.[17,18,31] These differences are supported by the experimental determinations.[33]

3.2. Effect of dielectric decrement on surface potential in a 2:1 + 1:2 mixed electrolyte solution

Based on the theoretical calculation of Eqs. (3) and (20), it is now possible to compare the GC theory (without considering the dielectric decrement) and this study (considering the dielectric decrement) in 2:1 + 1:2 mixed electrolyte solutions.

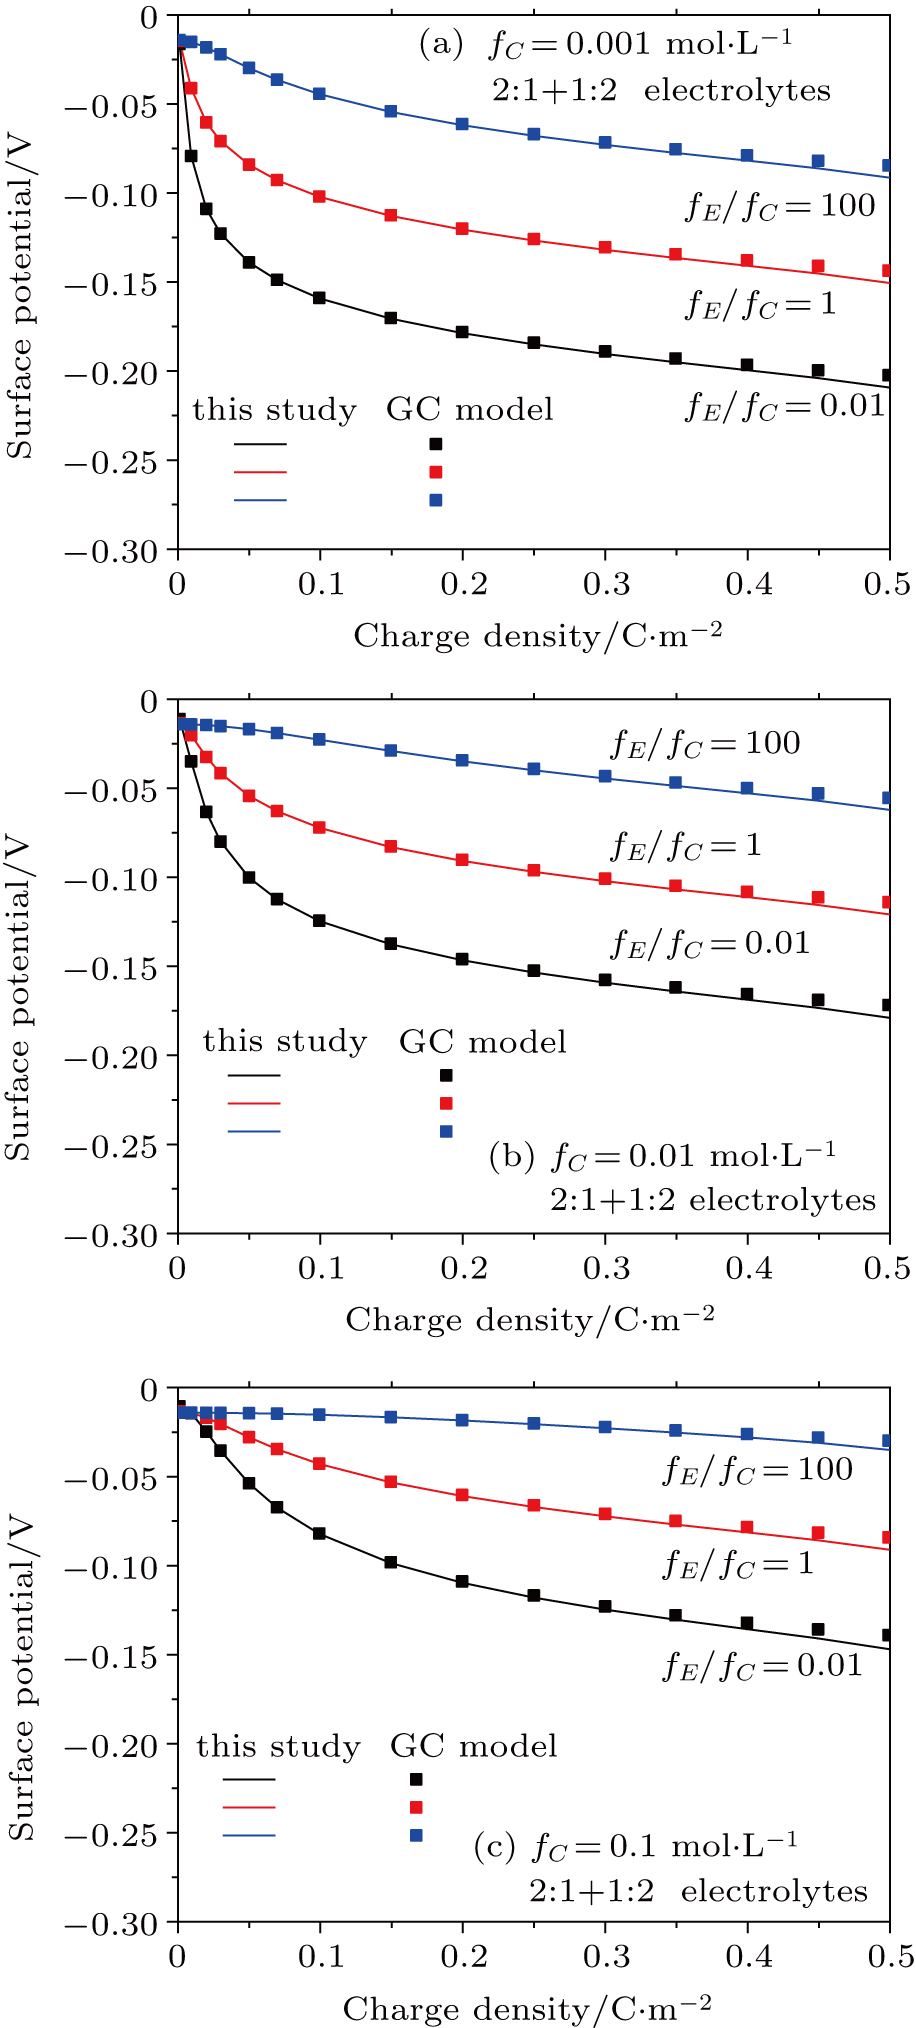
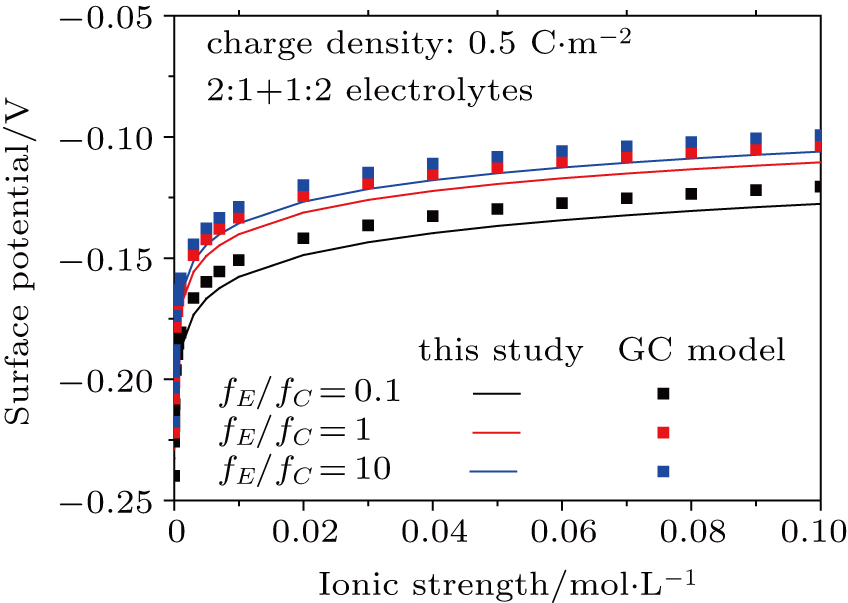
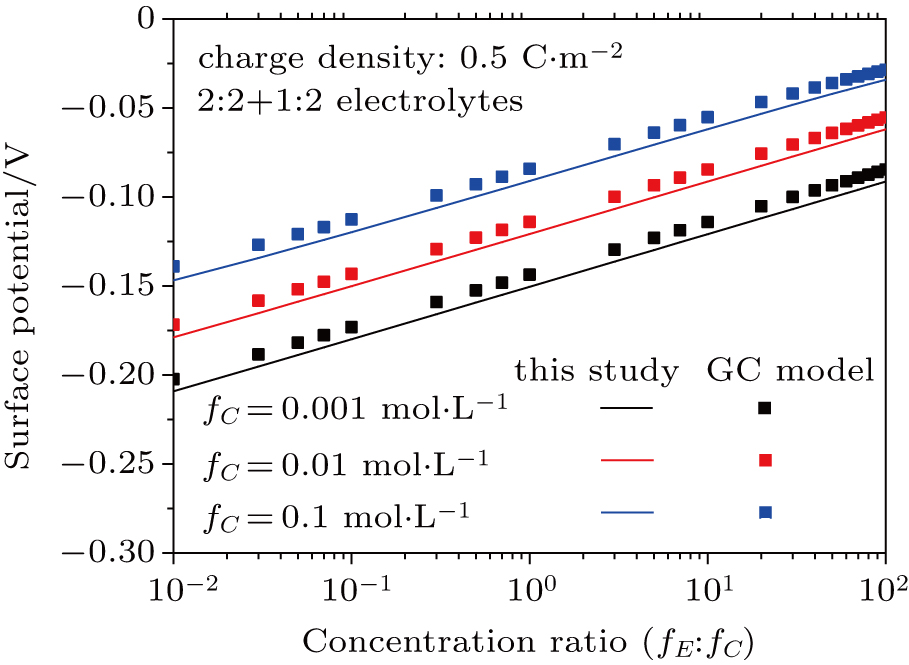
The surface potential increases with charge density increasing (Fig. 3), decreases with ion concentration increasing (Fig. 4) and decreases with concentration ratio of divalent to monovalent counter-ions increasing (Fig. 5). The dielectric decrement has little effect on the surface potential for a relatively low surface charge density. When the charge density exceeds 0.3 C·m−2, the dielectric decrement of the particles significantly affects the potential and increases with charge density increasing (Fig. 3). Figures 4 and 5 show that for the particles with a charge density of 0.5 C·m−2, the surface potential is underestimated by the GC model at any ion strength and different counter-ion concentration ratio, which is because the dielectric constant significantly decreases for high charge density (Fig. 1). For a low charge density, the new model can automatically return to the GC model (Fig. 3).

Fig. 3. (color online) Comparison between surface potentials from this study and the GC model for negatively charged particles with different charge densities in 1:2 + 2:1 mixed electrolyte solutions for fC =0.001 mol·L−1 (a), 0.01 mol·L−1 (b), and 0.1 mol·L−1 (c). Lines represent values calculated from this study with considering dielectric decrement, and symbols refer to values estimated from the GC model.
Fig. 4. (color online) Comparison between surface potentials obtained from this study and the GC model for negatively charged particles with different ion strengths in 1:2 + 2:1 mixed electrolytes. Lines represent values calculated from this study considering dielectric decrement and symbols refer to values estimated from the GC model.
Fig. 5. (color online) Comparison between surface potentials obtained from this study and the GC model with different concentration ratios of counter-ions in 1:2 + 2:1 mixed electrolytes. Lines denote values calculated from this study with considering dielectric decrement and symbols refer to values estimated from the GC model.
3.3. Effect of dielectric decrement on surface potential in a 2:2 + 1:2 mixed electrolyte solution

Based on the theoretical calculation of Eqs. (3) and (29), a comparison between the GC model and this study is performed in a 2:2 + 1:2 mixed electrolyte solution.

The results for 2:2 + 1:2 electrolytes shown in Figs. 68 are similar to those observed for 2:1 + 1:2 electrolytes (Figs. 35), which indicates that the difference between a monovalent ion and a bivalent co-ion is insignificant for the estimation of the surface potential. For the particles with a charge density of 0.5 C·m−2, the surface potential is also underestimated by the GC model at any ion strength (Fig. 7) and different counter-ion concentration ratios (Fig. 8) due to the decrease of dielectric constant at the surface with high charge density (Fig. 1). For a low charge density, the new model can automatically return to the GC model for a 2:2 + 1:2 electrolyte (Fig. 6).

Fig. 6. (color online) Comparison between surface potentials obtained from this study and the GC model for negatively charged particles with different charge densities in a 2:2+1:2 mixed electrolyte solutions for fC =0.001 mol·L−1 (a), 0.01 mol·L−1 (b), and 0.1 mol·L−1 (c). Lines represent values calculated from this study with considering dielectric decrement and symbols denote values estimated from the GC model.
Fig. 7. (color online) Comparison between surface potentials obtained from this study and the GC model for negatively charged particles with different ion strengths in 2:2 + 1:2 mixed electrolytes. Lines represent values calculated from this study considering dielectric decrement and symbols denote values estimated from the GC model.
Fig. 8. (color online) Comparison between surface potentials obtained from this study and the GC model in different concentration ratios of counter-ions with 2:2 + 1:2 mixed electrolytes. Lines represent values calculated from this study considering dielectric decrement and symbols refer to values estimated from the GC model.
3.4. Effect of dielectric decrement on surface potential in a 2:2 + 2:1 mixed electrolyte solution

Based on the theoretical calculations of Eqs. (3) and (38), it is possible to compare with the GC theory without considering the dielectric decrement and this study with considering dielectric decrement in 2:2 + 2:1 mixed electrolyte solutions.

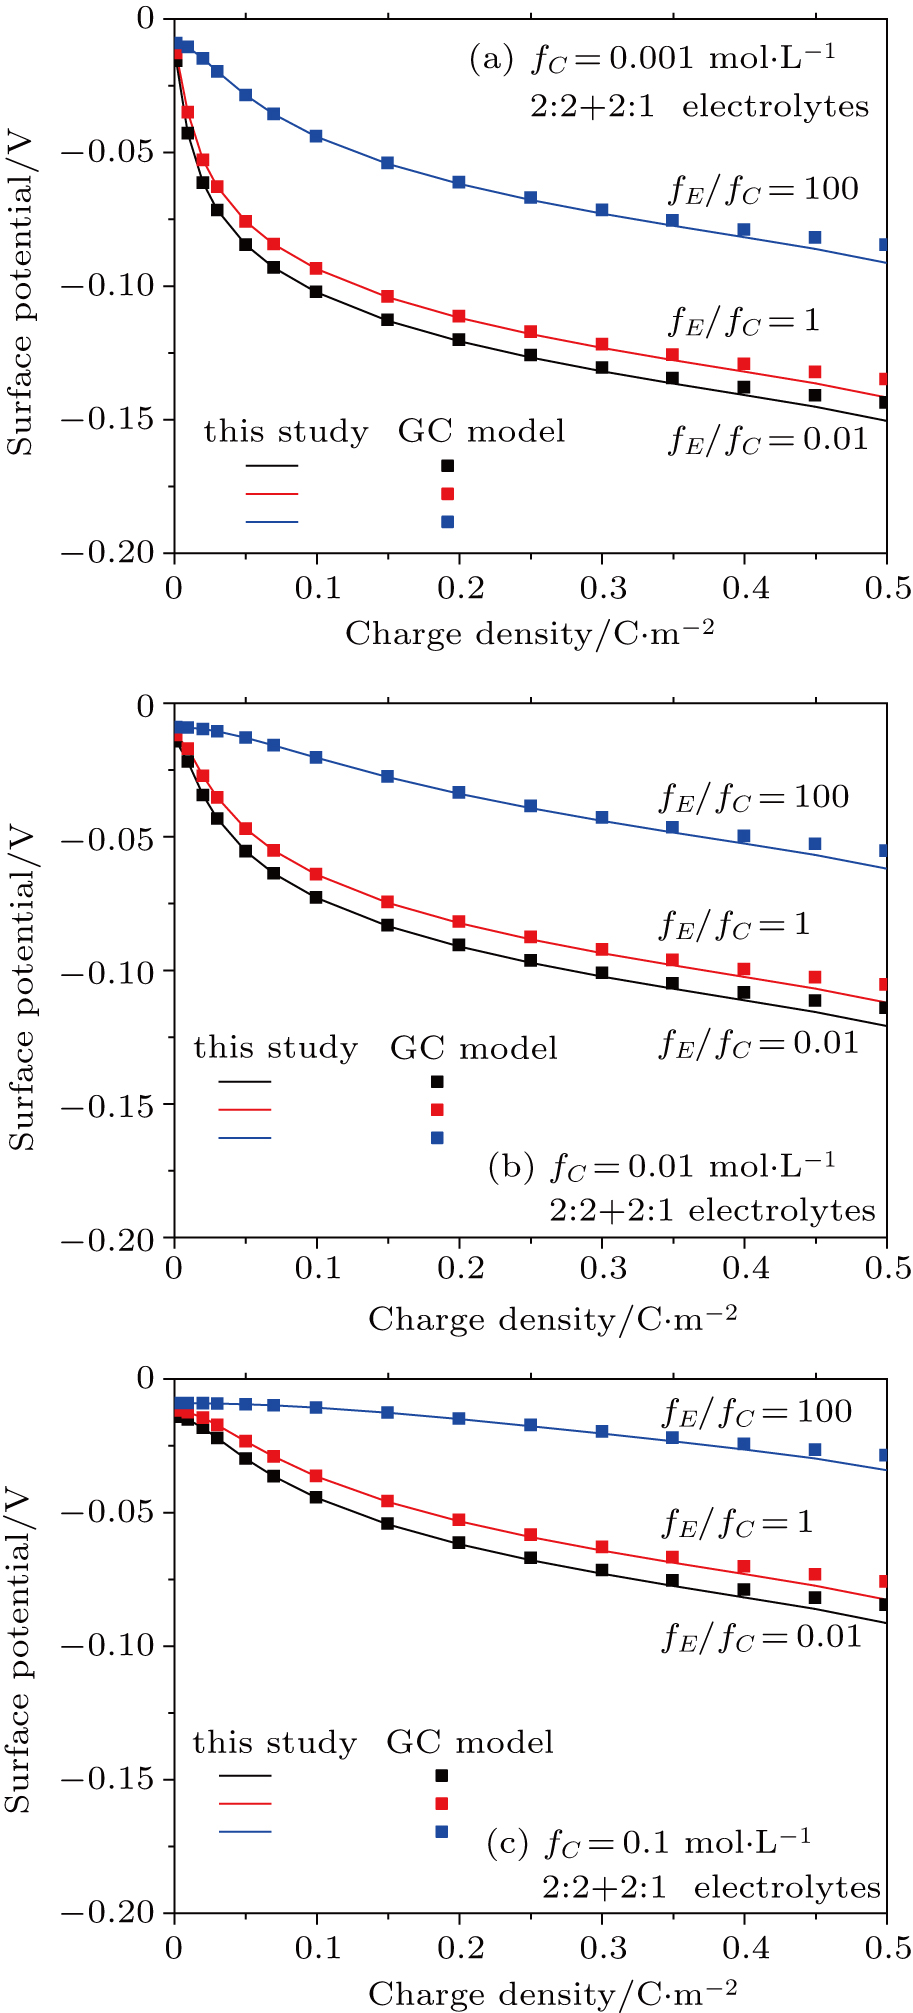
The trends in 2:2 + 2:1 electrolytes shown in Figs. 911 are also similar to those in the above systems. For particles with high charge density (e.g., 0.5 C·m−2), the surface potential is also underestimated by the GC model (Figs. 10 and 11) due to the decrease of dielectric constant at such a surface (Fig. 1). For a low charge density, the new model can automatically return to the GC model in 2:2 + 2:1 electrolytes (Fig. 9). However, compared with the above two systems, the bivalent counter-ion significantly reduces the surface potential because the interactions between bivalent counter-ions at the charged surface are stronger than those between monovalent ions at the surface.

Fig. 9. (color online) Comparison between surface potentials obtained from this study and the GC model for negatively charged particles with different charge densities in 2:2 + 2:1 mixed electrolyte solutions, for fC = 0.001 mol·L−1 (a), 0.01 mol·L−1 (b), and 0.1 mol·L−1 (c). The lines are calculated from this study considering dielectric decrement, and the symbols denote values estimated from the GC model.
Fig. 10. (color online) Comparison between surface potentials obtained from this study and the GC model for negatively charged particles with different ion strengths in 2:2 + 2:1 mixed electrolytes. Lines represent values calculated from this study considering dielectric decrement and symbols denote values estimated from the GC model.
Fig. 11. (color online) Comparison between surface potentials obtained from this study and the GC model with different concentration ratios of counter-ions in 2:2 + 2:1 mixed electrolytes. Lines represent values calculated from this study considering dielectric decrement and symbols denote values estimated from the GC model.

It is worth mentioning that only the ion–surface Coulomb interaction is considered in the present study. Based on the theory established in this article, the other factors regarded as the origins of Hofmeister effects, such as ion volume, dispersion and induction effects, will be taken into account in the ion–surface interactions. Combining the dielectric decrement with these factors, a more reliable theory for the estimation of surface potential will be established in subsequent studies. Furthermore, divalent ions show the evidence of specific adsorption into a Stern layer and hence the existence of an isoelectric point.[34] The charge states of variable charge surfaces can be changed due to specific adsorption, thus the surface potential can be changed.[35] In the Stern model the concept of a specific adsorption potential was introduced.[36] In the following studies in this series, the use of an extended model for conditions where specific adsorption potential takes place will be demonstrated.

4. Conclusions and perspectives

The principles of surface potential evaluation considering the dielectric decrement in mixed electrolyte solutions are established, and the effects of the dielectric decrement on surface potential are analyzed. A simple and convenient analytical relationship between the surface potential and charge density of nano/colloidal particles is derived. The surface potential can be theoretically calculated as long as the surface charge density of the particles is measured without solving the numerical solution of the PB equation. Dielectric decrement on the charged surface strongly affects the surface potential for a charge density > 0.3 C·m−2 in different ion strengths and concentration ratios of counter-ions. The hypothesis of a homogeneous medium in the GC model obviously underestimates the surface potential and overestimates the dielectric properties at the solid–liquid interface. This study provides an approach to estimating the interfacial interactions and surface potential by taking into account the Hofmeister effects, which will be performed in subsequent studies.

Reference
[1] Liu X Li H Du W Tian R Li R Jiang X 2013 J. Phys. Chem. 117 6245
[2] Liu X Li H Li R Xie D Ni J Wu L 2015 Sci. Rep. 4 5047
[3] Xin Y Zheng Y X Yu Y X 2016 Mol. Phys. 114 2328
[4] Hu F Xu C Li H Li S Yu Z Li Y He X 2015 Soil Till. Res. 147 1
[5] Xu C Li H Hu F Li S Liu X Li Y 2015 Eur. J. Soil Sci. 66 615
[6] Mugele F Bera B Cavalli A Siretanu I Maestro A Duits M Cohen-Stuart M Van Den Ende D Stocker I Collins I 2015 Sci. Rep. 5 10519
[7] Brogioli D 2009 Phys. Rev. Lett. 103 058501
[8] Trefalt G Behrens S H Borkovec M 2016 Langmuir 32 380
[9] Vlachy V 1999 Ann. Rev. Phys. Chem. 50 145
[10] Wang K Yu Y X Gao G H 2008 J. Chem. Phys. 128 185101
[11] Peng B Yu Y X 2009 J. Chem. Phys. 131 134703
[12] Liu X M Yang G Li H Li H Tian R Ding W Q Yuan R 2015 Chin. Phys. 24 068202
[13] Wan L Xu S Liao M Liu C Shen P 2014 Physics 43 589 in Chinese
[14] Liu Y Yan E C Zhao X Eisenthal K B 2001 Langmuir 17 2063
[15] Yan E C Y Liu Y Eisenthal K B 1998 J. Phys. Chem. 102 6331
[16] Brown M A Abbas Z Kleibert A Green R G Goel A May S Squires T M 2016 Phys. Rev. 6 011007
[17] Li H Wei S Qing C Yang J 2003 J. Colloid Interface Sci. 258 40
[18] Liu X Ding W Tian R Du W Li H 2017 Soil Sci. Soc. Am. J. 81 268
[19] Grahame D C 1950 J. Chem. Phys. 18 903
[20] Orl D H 2007 Phys. Rev. Lett. 99 077801
[21] Parkhurst D L Appelo C A J 2013 Description Input Examples For PHREEQC version 3—A computer program for speciation, batch- reaction, one-dimensional transport, and inverse geochemical calculations USGS
[22] Hou J Li H 2009 Soil Sci. Soc. Am. J. 73 1658
[23] Li H Qing C L Wei S Q Jiang X J 2004 J. Colloid Interface Sci. 275 172
[24] Zhao R van Soestbergen M Rijnaarts H H M van der Wal A Bazant M Z Biesheuvel P M 2012 J. Colloid Interface Sci. 384 38
[25] Liu X Tian R Li R Ding W Li H Yuan R 2015 Proc. Royal Soc. 471 20150064
[26] Sposito G 1984 The Surface Chemistry of Soils Oxford/New York Clarendon Press/Oxford University Press
[27] Gongadze E van Rienen U Kralj-Iglič V Iglič A 2011 Gen. Physiol. Biophys. 30 130
[28] Mashayak S Y Aluru N R 2017 J. Chem. Phys. 146 044108
[29] Liu X Li H Li R Tian R 2013 Surf. Sci. 607 197
[30] Gavish N Promislow K 2016 Phys. Rev. 94 012611
[31] Low P F 1981 Soil Sci. Soc. Am. J. 45 1074
[32] Parsons D F Ninham B W 2010 Langmuir 26 1816
[33] Bousse L J Mostarshed S Hafeman D 1992 Sensors Actuators B: Chem. 10 67
[34] Perram J W 1973 J. Chem. Soc. Faraday Trans. 69 993
[35] Bowden J W Posner A M Quirk J P 1977 Soil Res. 15 121
[36] Stern O 1924 Zeit. Elektrochem 30 508