† Corresponding author. E-mail:
Project supported by the Fundamental Research Funds for the Central Universities, China (Grant No. NS2017003).
The honeycomb phononic crystal displays good performance in reducing vibration, especially at low frequency, but there are few corresponding experiments involving this kind of phononic crystal and the influence of geometric parameters on the bandgap is unclear. We design a honeycomb phononic crystal, which is assembled by using a chemigum plate and a steel column, calculate the bandgaps of the phononic crystal, and analyze the vibration modes. In the experiment, we attach a same-sized rubber plate and a phononic crystal to a steel plate separately in order to compare their vibration reduction performances. We use 8 × 8 unit cells as a complete phononic crystal plate to imitate an infinite period structure and choose a string suspension arrangement to support the experiment. The results show that the honeycomb phononic crystal can reduce the vibrating plate magnitude by up to 60 dB in a frequency range of 600 Hz–900 Hz, while the rubber plate can reduce only about 20 dB. In addition, we study the effect of the thickness of plate and the height and the radius of the column in order to choose the most superior parameters to achieve low frequency and wide bandgap.
In modern warfare, military aircraft[1–3] play an indispensable role. How to reduce low-frequency vibration from our own equipment or enemy attack is key to measuring the combat performance of the aircraft. However, it is difficult to control the vibration of aircraft from the source because of many complicated reasons.[4–7] So, designing a kind of material with a low-frequency vibration reducing characteristic is very important.
Because there are many limitations to the practical engineering applications of traditional materials, artificial composite materials with special physical properties have become the focus of attention.[8] Phononic crystal[9–12] is a composite material composed of two or more materials with different bandgaps, and its elastic constant, density and sound velocity always change periodically. Phononic crystal has many good physics characteristics, of which the most significant and attractive is that it can reduce vibration and noise when the frequency of the elastic wave is at the bandgap frequency;[13] thus, the lower bandgap can be obtained by selecting a suitable scatterer, substrate and cladding layer, which can be used for controlling low-frequency vibration in mechanical equipment.
The formation of bandgaps is attributed to Bragg scattering[14,15] or the local resonance.[16] When the initial frequency of a bandgap is equal, the lattice constant of the local resonance phonon crystal is 1–2 orders of magnitude smaller than that of Bragg scattering type, which is suitable for controlling medium and low frequency noise.[17] The idea of local resonance phononic crystal was first described by Liu et al. in 2000;[18] then, a new field of phononic crystals opened up. There have been many studies of local resonance phonon crystals over the past two decades, mainly in the field of bandgap formation mechanism and bandgap calculation method or passive and active control of bandgap width and position. Wen et al.[13] introduced the bandgap mechanism and characteristics about Bragg scattering and the local resonance phononic crystal; moreover, they proposed five methods to calculate the bandgaps and studied two-dimensional (2D) phononic crystal with a honeycomb structure. They chose steel as the scatterer and chemigum as the base; analyzing and calculating the band structure with a concentrated mass method and obtaining a bandgap range from 200 Hz to 270 Hz. Zhang et al.[19] came up with a new hybrid phononic crystal and studied the effects of the geometrical parameters to control the wave propagation. They used the finite element method to calculate the bandgaps, successfully obtaining a wide gap between 247.996 Hz and 979.1 Hz. Li et al.[20] realized the active controlling of the bandgap of an elastic beam by using piezoelectric sensors with periodic distribution. They placed piezoelectric actuators and piezoelectric sensors above and below the beam, respectively, and adjusted the position and width of the bandgap through changing the parameters of the piezoelectric material and external control voltages. They designed a negative proportional feedback control method that adds an active stiffness to the elastic beam and is more flexible than passive control, which focuses on changing the parameters of the phononic crystal themselves.
However, most of the experiments on phononic crystal for reducing the low-frequency vibration focus on the bandgap of the crystal itself. There are few experiments on reducing the vibrations of real objects and there are fewer comparative experiments involving the honeycomb phononic crystal at low frequency. So, although many simulations show that the phononic crystal can reduce vibration in their bandgap, it is less persuasive than a concrete experiment. Sun[21] designed an experiment on an acoustic metamaterial, which had physical properties similar to those of phononic crystal and successfully verified that the metamaterial could reduce the vibrating plate resonance magnitudes by up to 42 dB in its system. In this paper, we design a honeycomb phononic crystal assembled by using a chemigum plate and a steel column, analyze its bandgap and transmission characteristics, and we attach a same-sized rubber plate and phononic crystal separately to a steel plate in order to make a comparison between their vibration reduction performances. We performed the simulation and its corresponding experiment to verify the physical properties in reducing vibration. We notice that this phononic crystal has a bandgap ranging from nearly 600 Hz to 900 Hz, and it can reduce vibration by up to 60 dB (averaging 23.32 dB). We also study the effect of the thickness of plate and the height and the radius of the column in order to choose the most superior parameter to achieve a low frequency and wide bandgap.
This paper aims to verify the vibration reduction characteristics experimentally and designs a most superior structure by optimizing the geometric parameters of the structure for reducing the low-frequency vibration. The present study provides new ideas and methods for practical application and has profound implications for military aircraft and related research.
Phononic crystal is a periodic composite, and its structure has elastic wave bandgaps, yet infinite periodic phononic crystal is only an ideal model. In the real world, phononic crystal only has a finite period, so we can simplify it into an original cell with periodic boundary conditions according to the band theory. The elastic wave propagation characteristics are reflected by the energy band structure, and the bandgap characteristics are described by the transmission characteristics of the incident elastic wave.
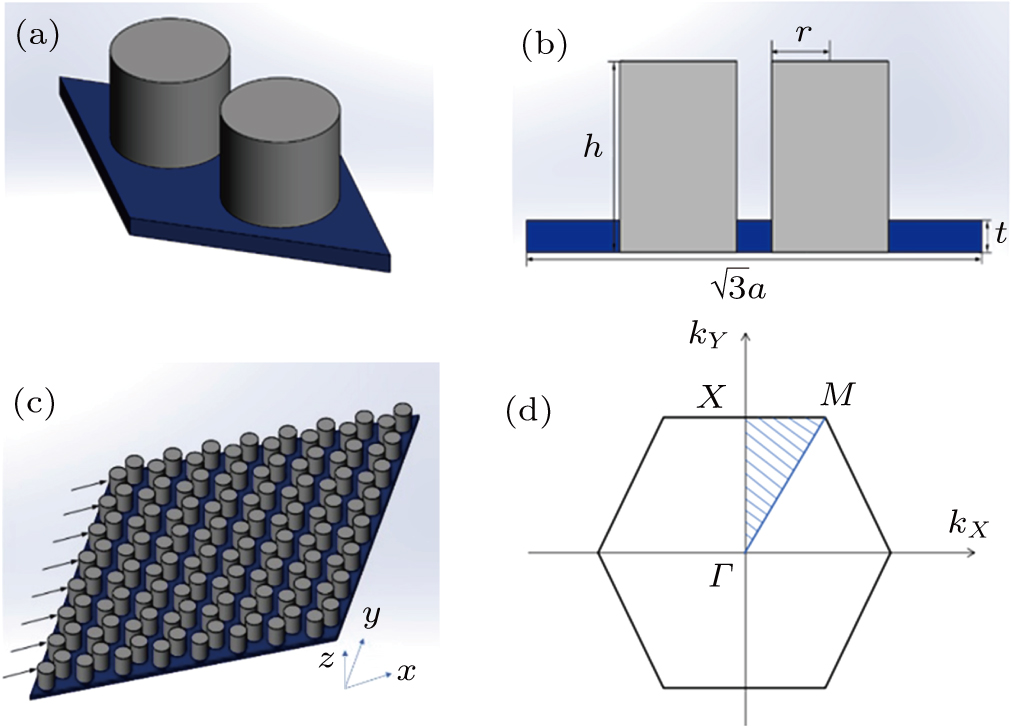
Phononic crystal has a honeycomb structure, which is assembled by using a chemigum plate and steel column. We use 8 × 8 unit cells as a complete phononic crystal plate to imitate an infinite period structure, the unit cell and the complete phononic crystal plate are shown in Fig.
| Table 1. Material properties of the honeycomb plate. . |
We calculate the bandgaps of the phononic crystal by using the finite element method (FEM). The unit cell is meshed and divided into finite elements. We can use the following generalized elastic eigenvalue to solve the problem, which can be written as
 |
 |
 |
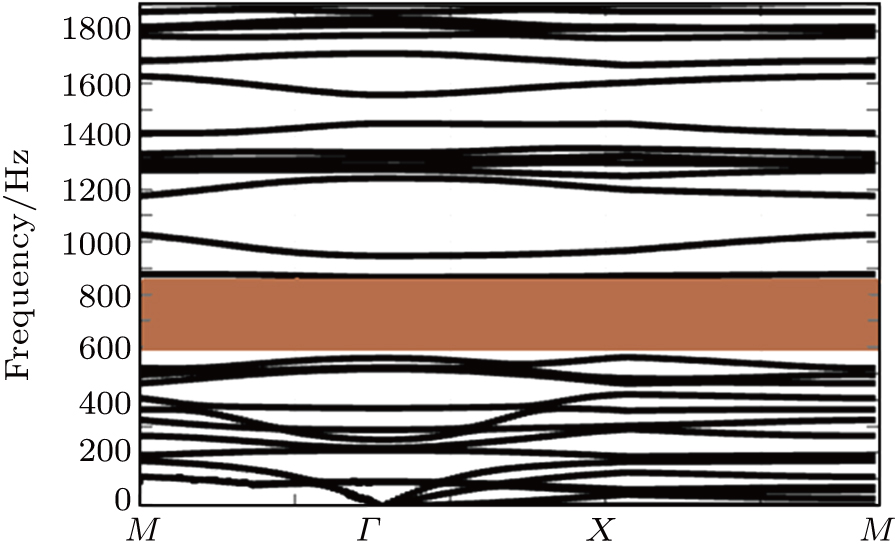
We take the wave vector k all over the boundary of the Brillouin region. M, X, and Γ are three of the vertices. Thus, the band structure can be calculated as shown in Fig.
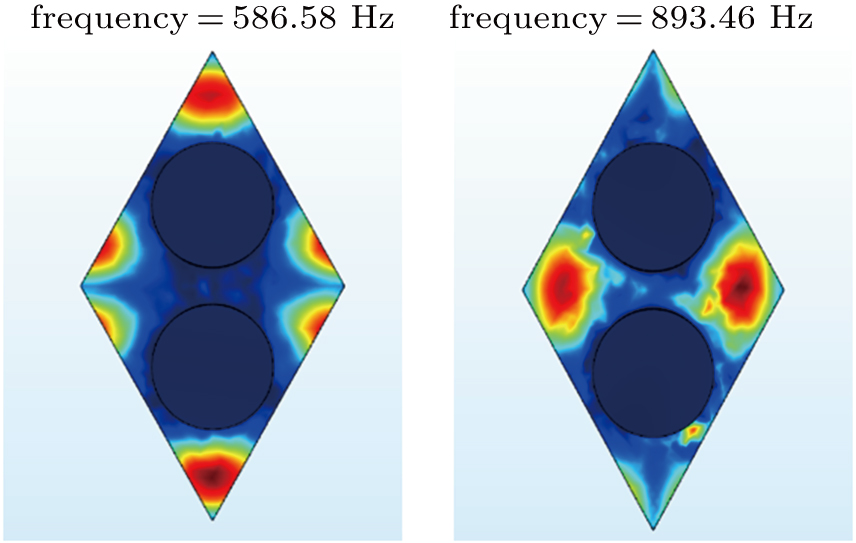 | Fig. 3. (color online) Vibration modes of phononic crystal, showing (a) lower edge of the bandgap, and (b) upper edge of the bandgap. |
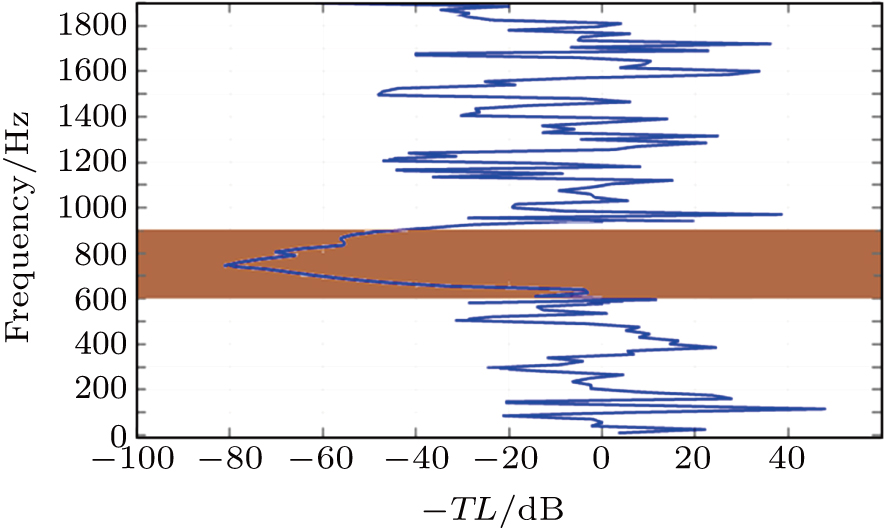
Moreover, we do not consider the physics character in the z direction because the periodicity only exists in the x- and y-directions, and we use only the acceleration in one of the directions in the x–y plane because of the symmetry. An acceleration of ‘1’ is applied to the left boundary in Fig.
 |
In this section, we verify that this honeycomb phononic crystal has a bandgap ranging from 586.58 Hz to 893.46 Hz, which can reduce vibration and prevent wave propagation. In the following section, we will further verify its vibration damping characteristics through simulation and experiment.
To verify the vibration damping characteristics of this honeycomb structure more practically, we attach the phononic crystal to a steel plate (Fig.
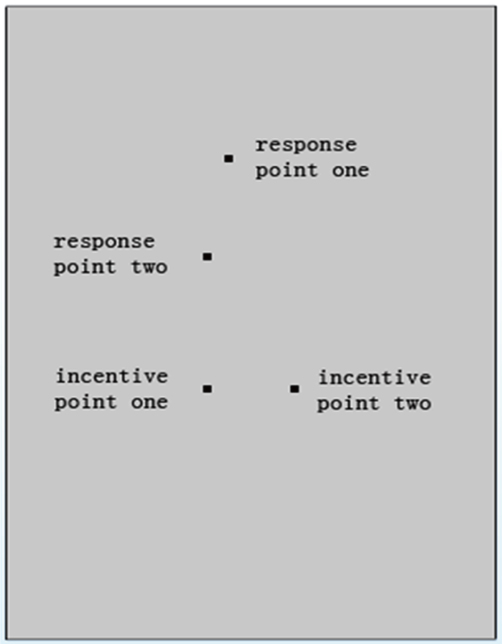
Two incentive points and two response points are selected in the steel plate, as shown in Fig.
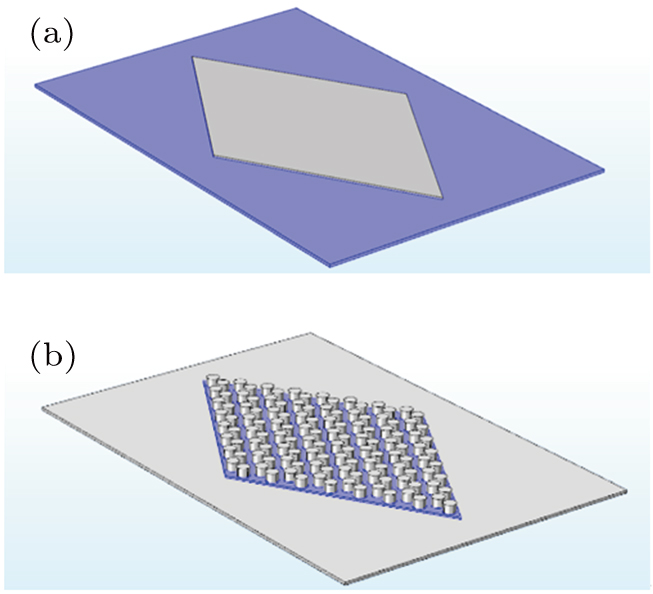 | Fig. 5. (color online) Models of simulation for (a) rubber-attached crystal and (b) phononic-attached crystal. |
To show the vibration damping characteristics more clearly, we define two variables below.
 |
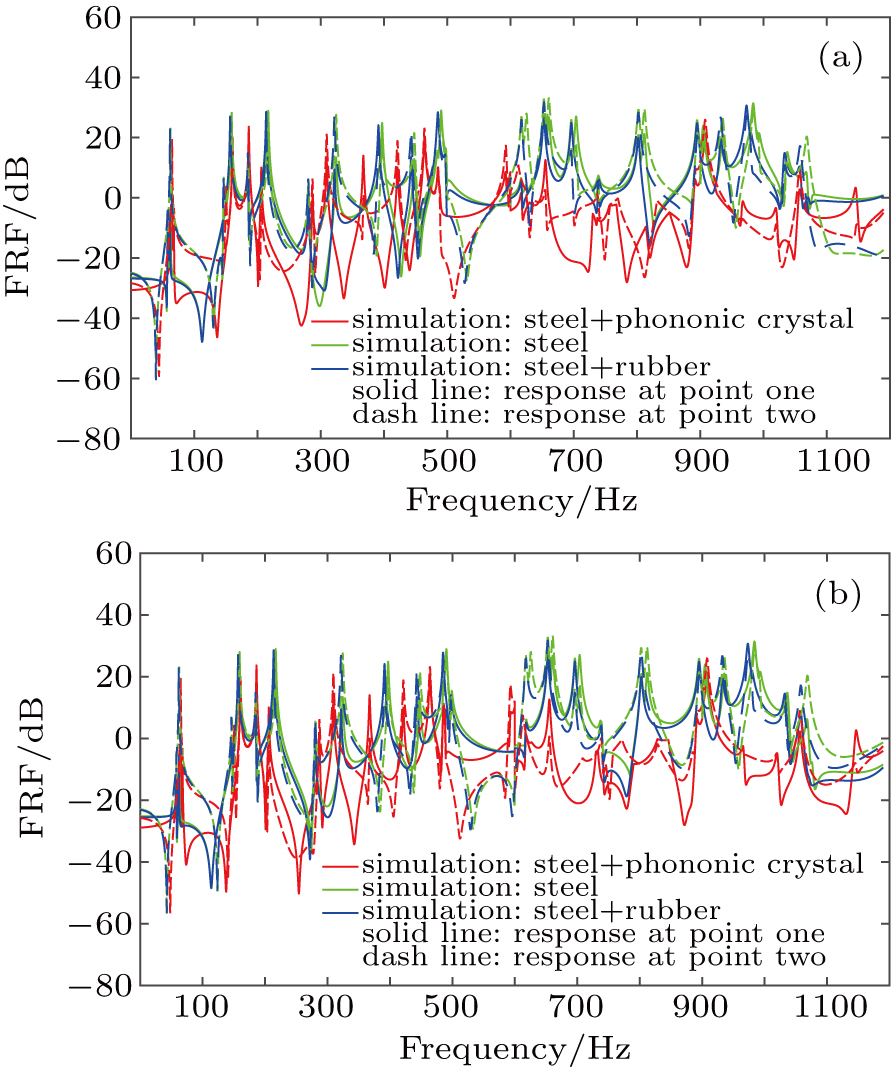 | Fig. 7. (color online) Frequency response function for (a) incentive at point one, (b) incentive at point two. |
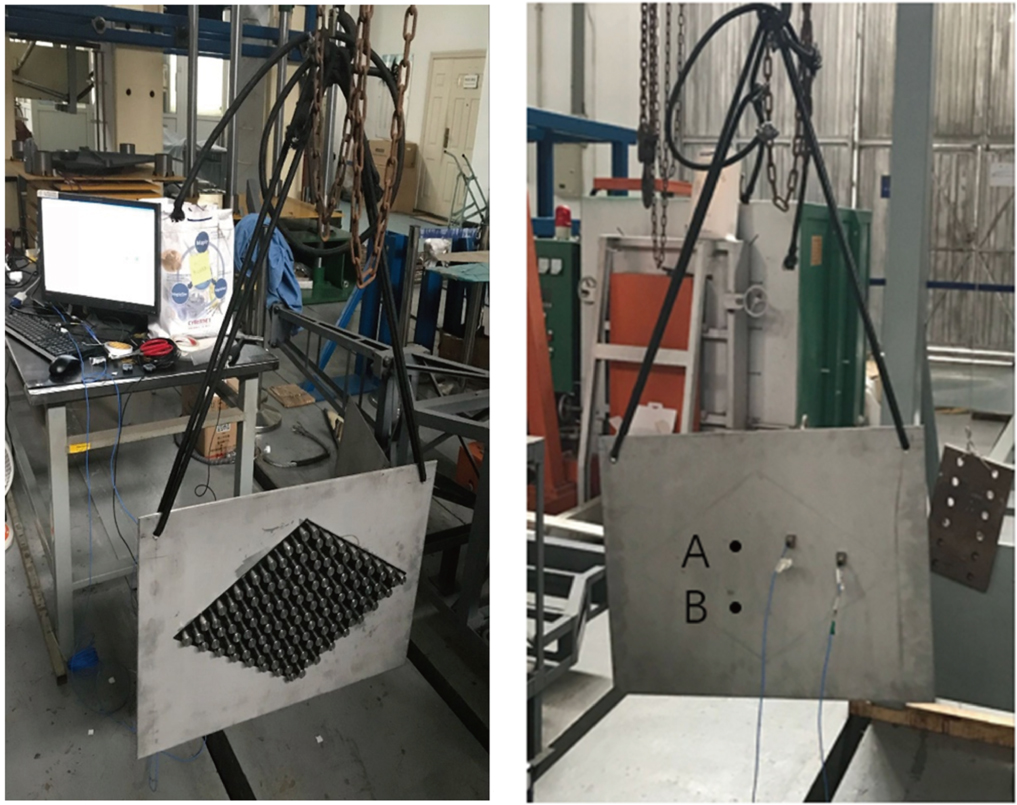
We perform a corresponding experiment to verify the simulation results. The materials used in the experiment are shown in Fig.
 | Fig. 9. Materials used in experiment, showing (a) rubber- and (b) phononic-crystal-attached steel plates. |
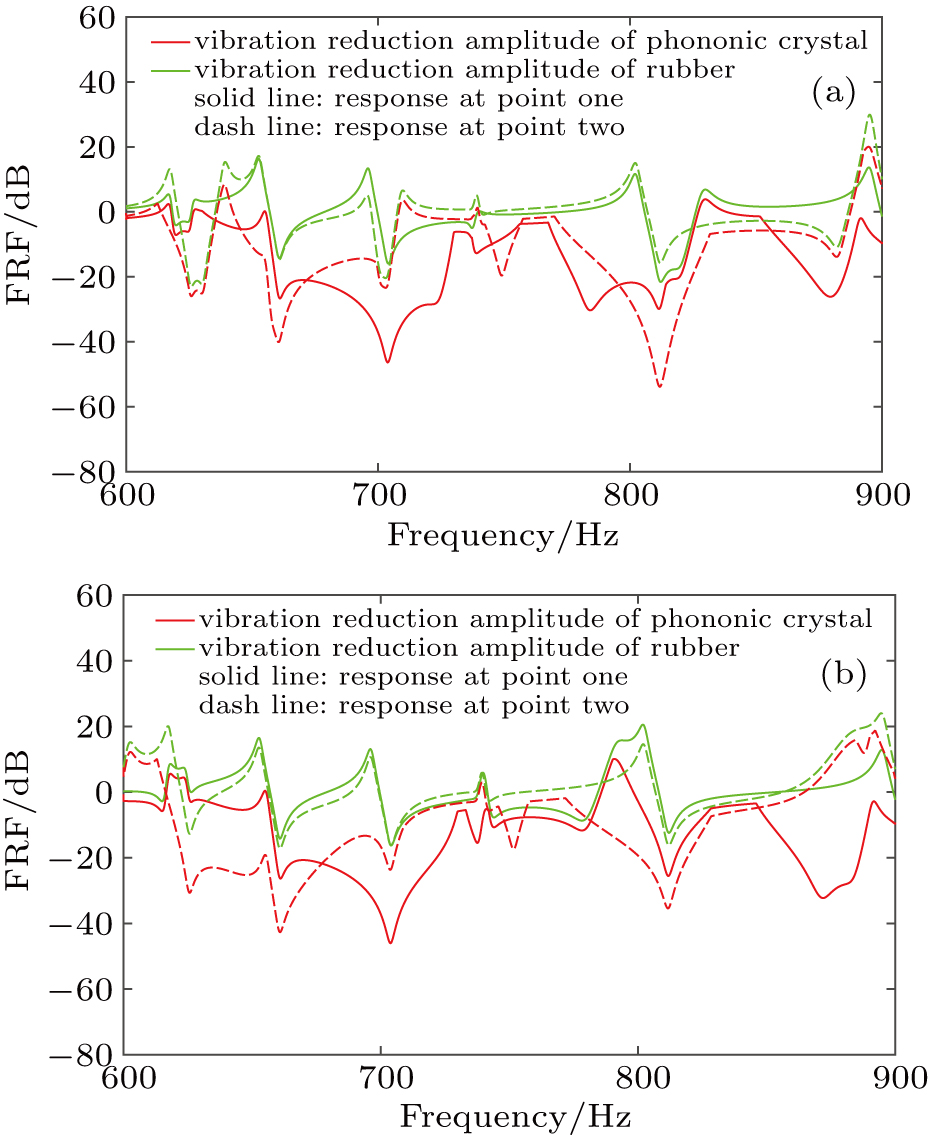
The experimental results are then organized and processed by Matlab software, which are shown in Fig.
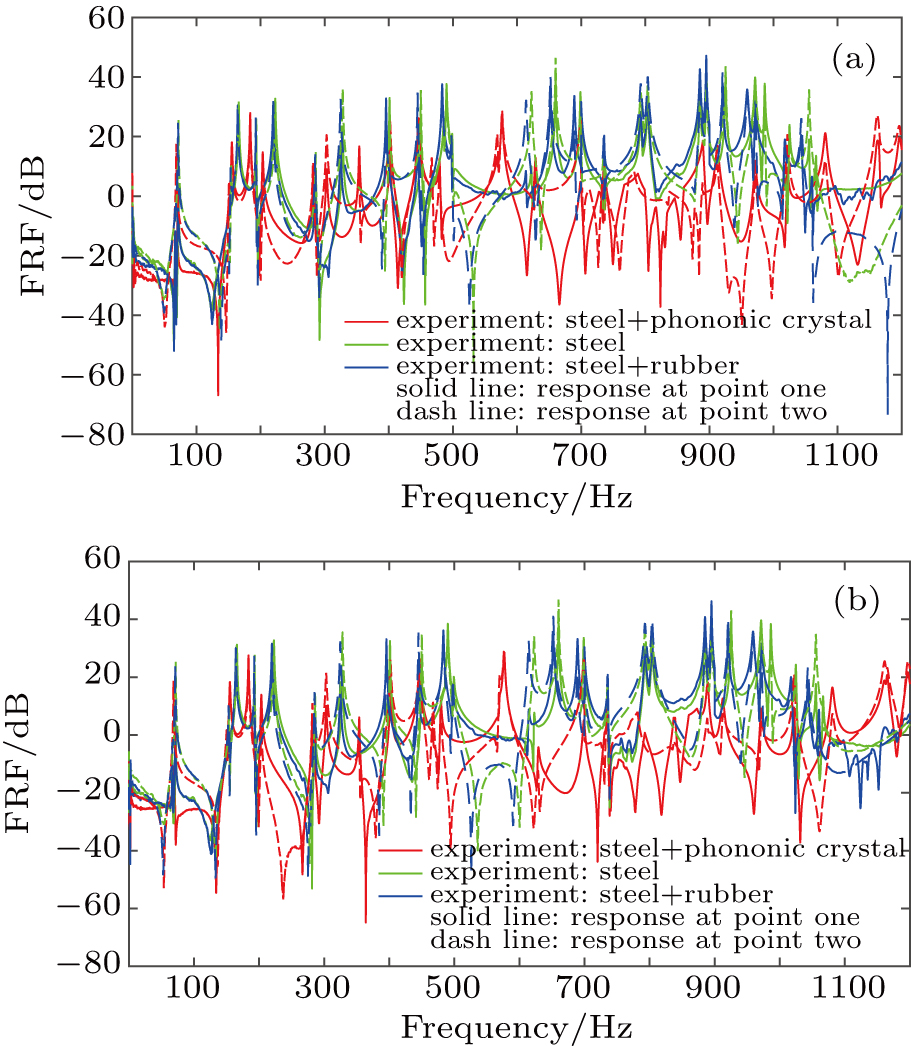 | Fig. 11. (color online) Vibration magnitude reduction for (a) incentive at point one and (b) incentive at point two. |
We can notice that the results are the same as simulation: the vibration decreases more sharply for phononic crystal than for rubber in a frequency range from 600 Hz to 900 Hz (in the bandgap), and the magnitude decreases by up to near 60 dB (averaging 20.36 Hz, 26.12 Hz, 23.96 Hz, and 19.19 Hz at response points one and two, respectively). The average values are slightly larger than the simulation values, for which the main reason is that we do not consider the effect of damping in the simulation and there are some losses of energy in the experiment. So, the vibration reduction performance of phononic crystal in the practical application is inferior to that of simulation.
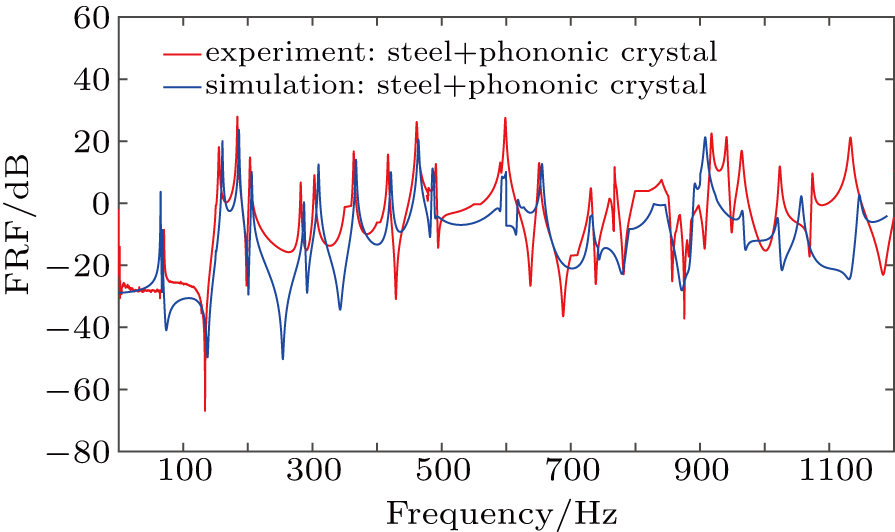
Figure
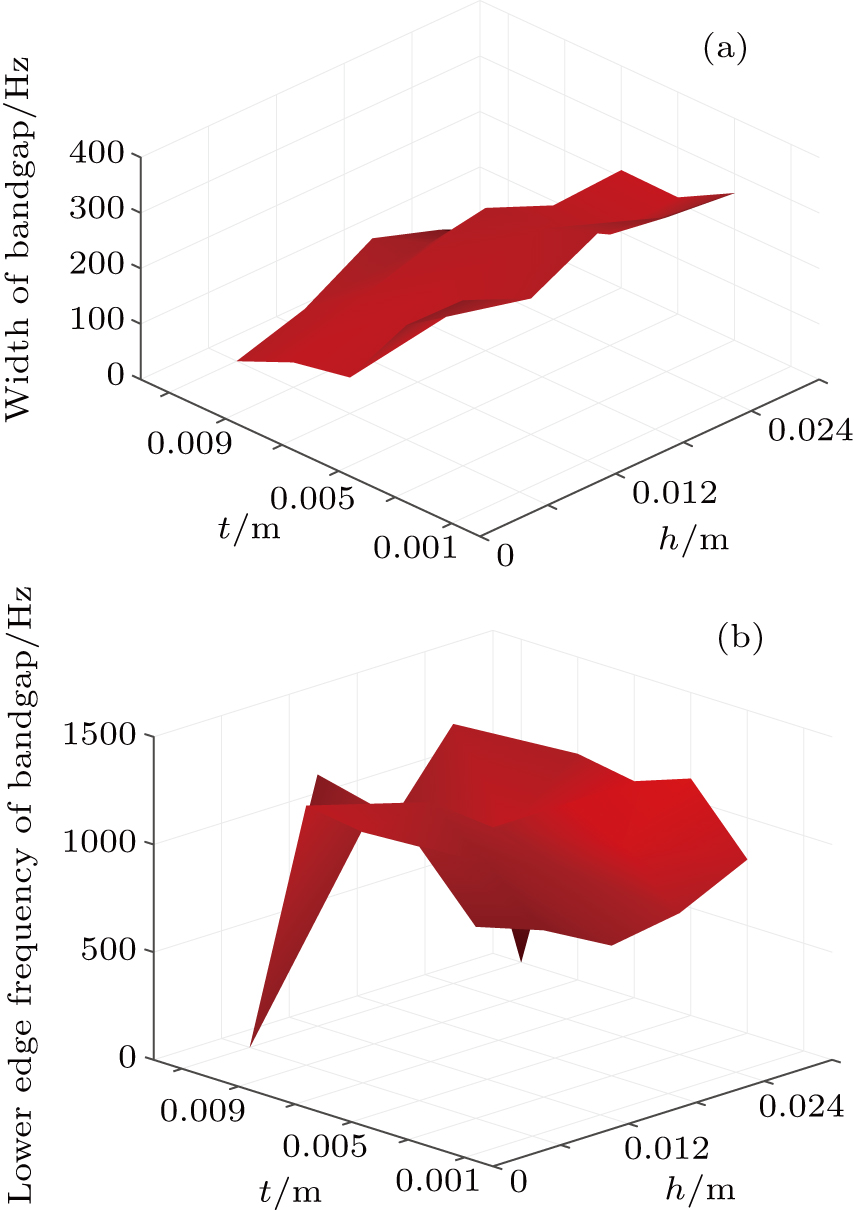
To further investigate the parameter effect of the honeycomb phononic crystal on bandgap, the thickness t of the plate and the radius r and the height h of the column are changed while the other parameters of the materials and the geometric structure are fixed. We choose the thickness t varying from 3 mm to 11 mm and the height h varying from 6 mm to 30 mm. Figure
From what has been discussed above, if we need to achieve a low frequency and wider bandgap of a honeycomb phononic crystal, we should reduce the plate thickness properly and find the best column height.
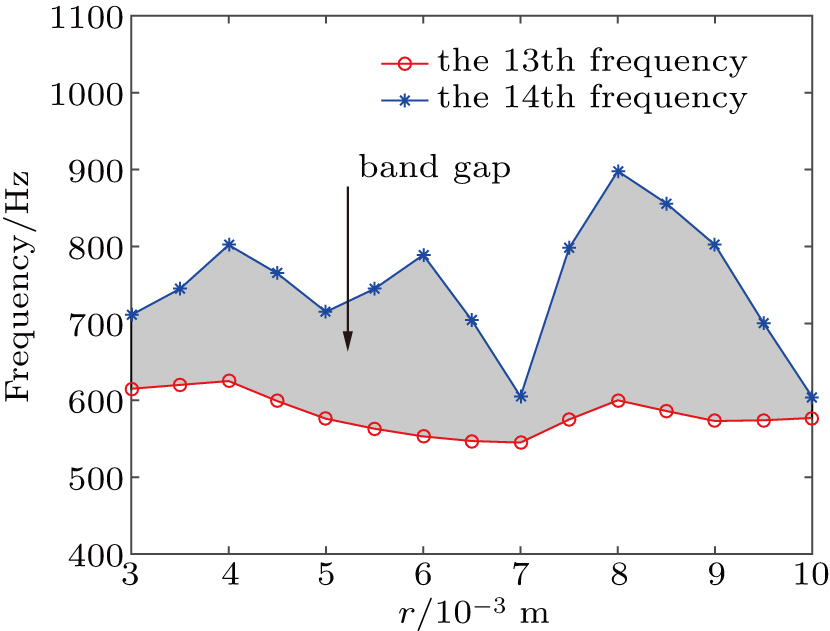
We study the effect of radius of the column on bandgap in this section. The thickness t is kept at 3 mm and the height h is kept at 18 mm. We change the radius r of the column from 3 mm to 10 mm, the first bandgap is between the 13th frequency and the 14th frequency. We can find from Fig.
In this paper, we have designed a honeycomb phononic crystal and calculated its bandgap by the FEM by noting that it has good vibration reduction performance in a frequency range of 600 Hz–900 Hz. We also analyze its vibration modes and transmission characteristic, which fits well to the bandgap. The simulation and corresponding experiment are also performed. The simulation results of the frequency response function of the system show that the honeycomb phononic crystal could reduce the vibrating plate magnitudes by up to 60 dB (averaging 21.03 dB), while the rubber plate can decrease it only about 20 dB. However, the experimental results (averaging 23.12 dB) are slightly larger than simulation results. The main reason for this is that the effect of damping in the simulation is not taken into consideration and there are some losses of energy in the experiment. In spite of this, the experimental results have the same trend as the simulation results in a frequency range of 600 Hz–900 Hz. It can further be verified that this honeycomb phononic crystal has a perfect vibration reduction performance in its bandgap, which can have profound meaning for vibration reduction in practical applications. We also study the parameter effect on bandgap, and the results show that the width of the bandgap decreases with the thickness increasing and at the height h = 18 mm, the width of bandgap reaches a maximum value, with the thickness kept unchanged. In addition, we also find that the 13th frequency has little change and just wanders around 600 Hz while the 14th frequency fluctuates a lot as the radius increases. So, choosing the parameter appropriately can help us achieve a lower frequency and wider bandgap.
| [1] | |
| [2] | |
| [3] | |
| [4] | |
| [5] | |
| [6] | |
| [7] | |
| [8] | |
| [9] | |
| [10] | |
| [11] | |
| [12] | |
| [13] | |
| [14] | |
| [15] | |
| [16] | |
| [17] | |
| [18] | |
| [19] | |
| [20] | |
| [21] |


