Evolution of the Internet AS-level topology: From nodes and edges to components
Project supported by the National Natural Science Foundation of China (Grant No. 61671142).
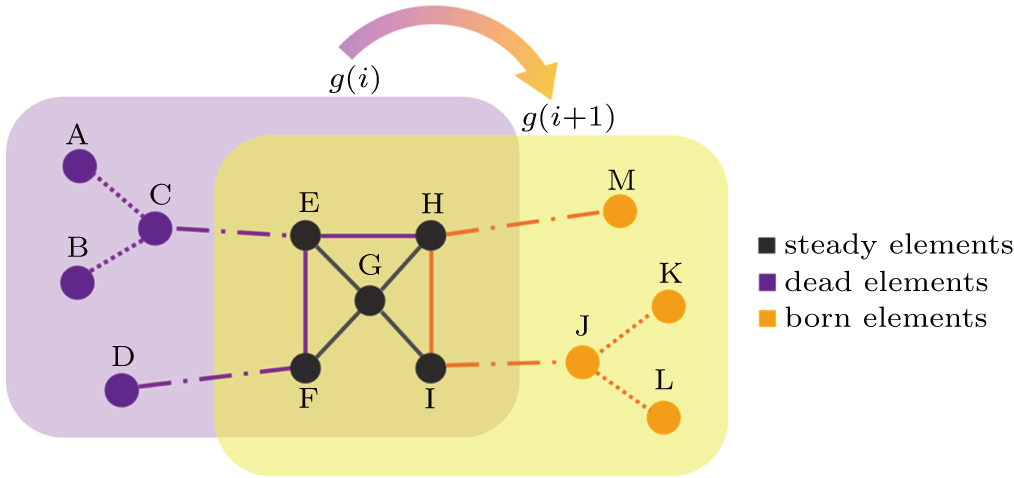
(color online) Schematic diagram of network evolution from t(i) to t(i + 1). The two shades g(i) and g(i + 1) refer to the topology snapshot at time i and i + 1, respectively. The overlap of both shades denotes the area that remains unchanged from t(i) to t(i + 1), covering the steady nodes {E, H, G, F, I} and edges. The purple shade on the left contains the vanishing nodes {A, B, C, D} and edges {